Immigrants from Panama vs Ecuadorian Births to Unmarried Women
COMPARE
Immigrants from Panama
Ecuadorian
Births to Unmarried Women
Births to Unmarried Women Comparison
Immigrants from Panama
Ecuadorians
34.2%
BIRTHS TO UNMARRIED WOMEN
3.3/ 100
METRIC RATING
227th/ 347
METRIC RANK
33.3%
BIRTHS TO UNMARRIED WOMEN
10.5/ 100
METRIC RATING
211th/ 347
METRIC RANK
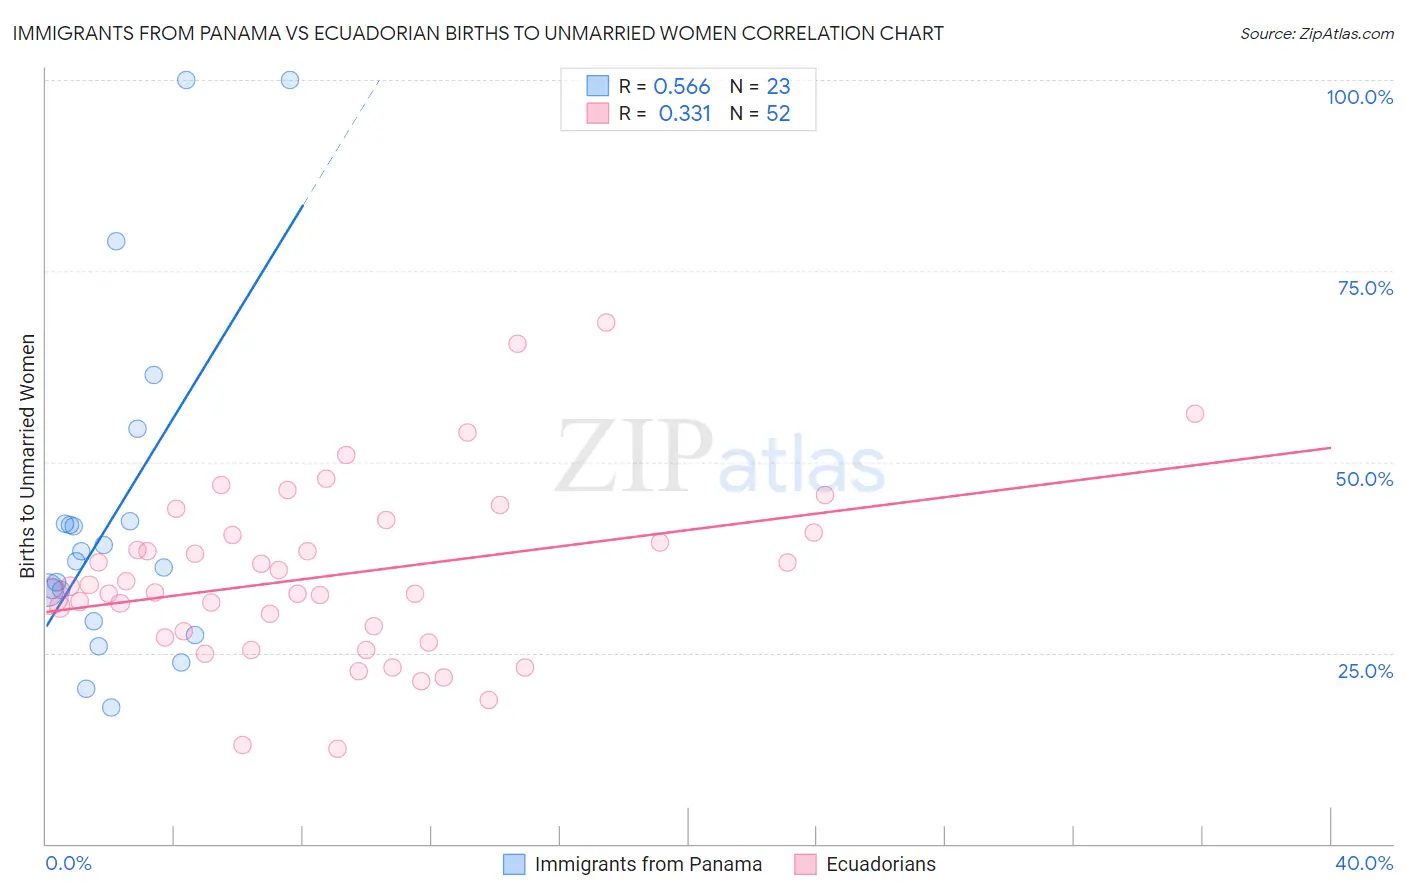
Immigrants from Panama vs Ecuadorian Births to Unmarried Women Correlation Chart
The statistical analysis conducted on geographies consisting of 213,926,652 people shows a substantial positive correlation between the proportion of Immigrants from Panama and percentage of births to unmarried women in the United States with a correlation coefficient (R) of 0.566 and weighted average of 34.2%. Similarly, the statistical analysis conducted on geographies consisting of 300,726,329 people shows a mild positive correlation between the proportion of Ecuadorians and percentage of births to unmarried women in the United States with a correlation coefficient (R) of 0.331 and weighted average of 33.3%, a difference of 2.8%.
Births to Unmarried Women Correlation Summary
| Measurement | Immigrants from Panama | Ecuadorian |
| Minimum | 17.8% | 12.5% |
| Maximum | 100.0% | 68.3% |
| Range | 82.2% | 55.8% |
| Mean | 43.1% | 35.1% |
| Median | 36.9% | 33.3% |
| Interquartile 25% (IQ1) | 29.1% | 27.4% |
| Interquartile 75% (IQ3) | 42.2% | 40.6% |
| Interquartile Range (IQR) | 13.1% | 13.2% |
| Standard Deviation (Sample) | 22.4% | 11.5% |
| Standard Deviation (Population) | 21.9% | 11.3% |
Demographics Similar to Immigrants from Panama and Ecuadorians by Births to Unmarried Women
In terms of births to unmarried women, the demographic groups most similar to Immigrants from Panama are Delaware (34.2%, a difference of 0.010%), Panamanian (34.2%, a difference of 0.030%), Immigrants from Sierra Leone (34.2%, a difference of 0.14%), Spanish (34.1%, a difference of 0.41%), and Pennsylvania German (34.0%, a difference of 0.57%). Similarly, the demographic groups most similar to Ecuadorians are White/Caucasian (33.3%, a difference of 0.050%), Scotch-Irish (33.3%, a difference of 0.050%), Celtic (33.3%, a difference of 0.070%), Immigrants from Costa Rica (33.4%, a difference of 0.26%), and Slovak (33.4%, a difference of 0.30%).
| Demographics | Rating | Rank | Births to Unmarried Women |
| Whites/Caucasians | 10.7 /100 | #209 | Poor 33.3% |
| Scotch-Irish | 10.7 /100 | #210 | Poor 33.3% |
| Ecuadorians | 10.5 /100 | #211 | Poor 33.3% |
| Celtics | 10.2 /100 | #212 | Poor 33.3% |
| Immigrants | Costa Rica | 9.5 /100 | #213 | Tragic 33.4% |
| Slovaks | 9.3 /100 | #214 | Tragic 33.4% |
| French | 8.7 /100 | #215 | Tragic 33.4% |
| Nepalese | 7.8 /100 | #216 | Tragic 33.5% |
| Spaniards | 7.0 /100 | #217 | Tragic 33.6% |
| Immigrants | Ecuador | 5.9 /100 | #218 | Tragic 33.7% |
| Alsatians | 5.4 /100 | #219 | Tragic 33.8% |
| Portuguese | 5.4 /100 | #220 | Tragic 33.8% |
| Malaysians | 5.0 /100 | #221 | Tragic 33.9% |
| Immigrants | Uruguay | 4.8 /100 | #222 | Tragic 33.9% |
| Pennsylvania Germans | 4.3 /100 | #223 | Tragic 34.0% |
| Immigrants | Laos | 4.3 /100 | #224 | Tragic 34.0% |
| Spanish | 4.0 /100 | #225 | Tragic 34.1% |
| Delaware | 3.3 /100 | #226 | Tragic 34.2% |
| Immigrants | Panama | 3.3 /100 | #227 | Tragic 34.2% |
| Panamanians | 3.3 /100 | #228 | Tragic 34.2% |
| Immigrants | Sierra Leone | 3.1 /100 | #229 | Tragic 34.2% |