Choctaw vs Ecuadorian Births to Unmarried Women
COMPARE
Choctaw
Ecuadorian
Births to Unmarried Women
Births to Unmarried Women Comparison
Choctaw
Ecuadorians
36.9%
BIRTHS TO UNMARRIED WOMEN
0.1/ 100
METRIC RATING
272nd/ 347
METRIC RANK
33.3%
BIRTHS TO UNMARRIED WOMEN
10.5/ 100
METRIC RATING
211th/ 347
METRIC RANK
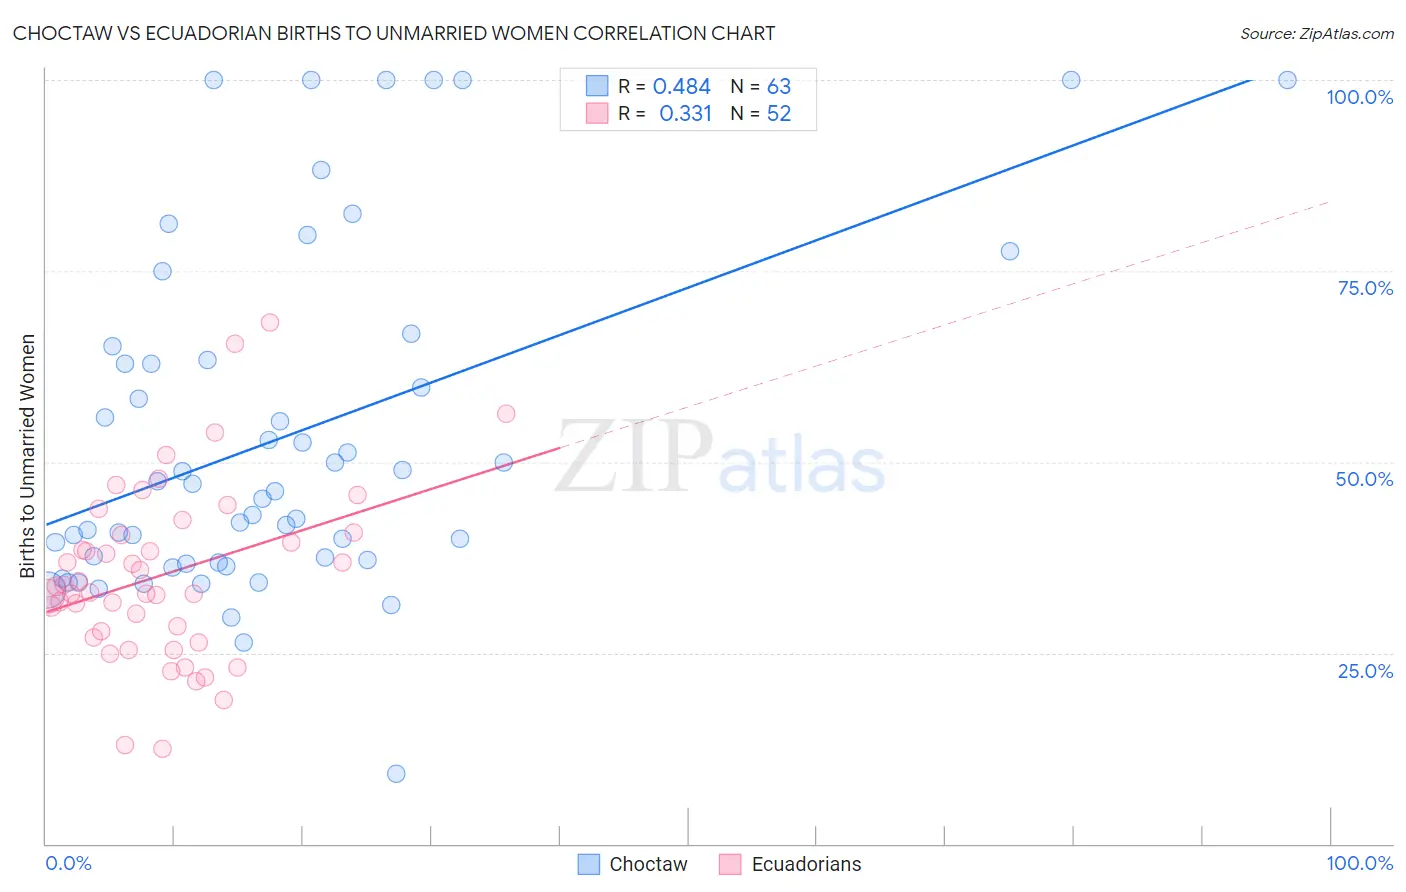
Choctaw vs Ecuadorian Births to Unmarried Women Correlation Chart
The statistical analysis conducted on geographies consisting of 258,635,203 people shows a moderate positive correlation between the proportion of Choctaw and percentage of births to unmarried women in the United States with a correlation coefficient (R) of 0.484 and weighted average of 36.9%. Similarly, the statistical analysis conducted on geographies consisting of 300,726,329 people shows a mild positive correlation between the proportion of Ecuadorians and percentage of births to unmarried women in the United States with a correlation coefficient (R) of 0.331 and weighted average of 33.3%, a difference of 10.8%.
Births to Unmarried Women Correlation Summary
| Measurement | Choctaw | Ecuadorian |
| Minimum | 9.1% | 12.5% |
| Maximum | 100.0% | 68.3% |
| Range | 90.9% | 55.8% |
| Mean | 53.2% | 35.1% |
| Median | 46.2% | 33.3% |
| Interquartile 25% (IQ1) | 36.9% | 27.4% |
| Interquartile 75% (IQ3) | 63.4% | 40.6% |
| Interquartile Range (IQR) | 26.5% | 13.2% |
| Standard Deviation (Sample) | 22.4% | 11.5% |
| Standard Deviation (Population) | 22.2% | 11.3% |
Similar Demographics by Births to Unmarried Women
Demographics Similar to Choctaw by Births to Unmarried Women
In terms of births to unmarried women, the demographic groups most similar to Choctaw are Mexican (36.9%, a difference of 0.12%), Cree (37.0%, a difference of 0.21%), Immigrants from Barbados (36.8%, a difference of 0.22%), Barbadian (37.0%, a difference of 0.23%), and Immigrants from Congo (36.8%, a difference of 0.24%).
| Demographics | Rating | Rank | Births to Unmarried Women |
| Cherokee | 0.1 /100 | #265 | Tragic 36.7% |
| Immigrants | Senegal | 0.1 /100 | #266 | Tragic 36.7% |
| Central Americans | 0.1 /100 | #267 | Tragic 36.7% |
| Comanche | 0.1 /100 | #268 | Tragic 36.7% |
| Senegalese | 0.1 /100 | #269 | Tragic 36.8% |
| Immigrants | Congo | 0.1 /100 | #270 | Tragic 36.8% |
| Immigrants | Barbados | 0.1 /100 | #271 | Tragic 36.8% |
| Choctaw | 0.1 /100 | #272 | Tragic 36.9% |
| Mexicans | 0.1 /100 | #273 | Tragic 36.9% |
| Cree | 0.1 /100 | #274 | Tragic 37.0% |
| Barbadians | 0.1 /100 | #275 | Tragic 37.0% |
| Belizeans | 0.1 /100 | #276 | Tragic 37.0% |
| Guatemalans | 0.1 /100 | #277 | Tragic 37.1% |
| Immigrants | Latin America | 0.1 /100 | #278 | Tragic 37.1% |
| West Indians | 0.1 /100 | #279 | Tragic 37.3% |
Demographics Similar to Ecuadorians by Births to Unmarried Women
In terms of births to unmarried women, the demographic groups most similar to Ecuadorians are White/Caucasian (33.3%, a difference of 0.050%), Scotch-Irish (33.3%, a difference of 0.050%), Celtic (33.3%, a difference of 0.070%), Hawaiian (33.2%, a difference of 0.19%), and Immigrants from Sudan (33.2%, a difference of 0.22%).
| Demographics | Rating | Rank | Births to Unmarried Women |
| Immigrants | Africa | 14.3 /100 | #204 | Poor 33.0% |
| German Russians | 13.1 /100 | #205 | Poor 33.1% |
| Uruguayans | 12.8 /100 | #206 | Poor 33.1% |
| Immigrants | Sudan | 11.5 /100 | #207 | Poor 33.2% |
| Hawaiians | 11.3 /100 | #208 | Poor 33.2% |
| Whites/Caucasians | 10.7 /100 | #209 | Poor 33.3% |
| Scotch-Irish | 10.7 /100 | #210 | Poor 33.3% |
| Ecuadorians | 10.5 /100 | #211 | Poor 33.3% |
| Celtics | 10.2 /100 | #212 | Poor 33.3% |
| Immigrants | Costa Rica | 9.5 /100 | #213 | Tragic 33.4% |
| Slovaks | 9.3 /100 | #214 | Tragic 33.4% |
| French | 8.7 /100 | #215 | Tragic 33.4% |
| Nepalese | 7.8 /100 | #216 | Tragic 33.5% |
| Spaniards | 7.0 /100 | #217 | Tragic 33.6% |
| Immigrants | Ecuador | 5.9 /100 | #218 | Tragic 33.7% |