Hmong vs Immigrants from Italy College, 1 year or more
COMPARE
Hmong
Immigrants from Italy
College, 1 year or more
College, 1 year or more Comparison
Hmong
Immigrants from Italy
57.2%
COLLEGE, 1 YEAR OR MORE
5.4/ 100
METRIC RATING
224th/ 347
METRIC RANK
61.2%
COLLEGE, 1 YEAR OR MORE
91.1/ 100
METRIC RATING
128th/ 347
METRIC RANK
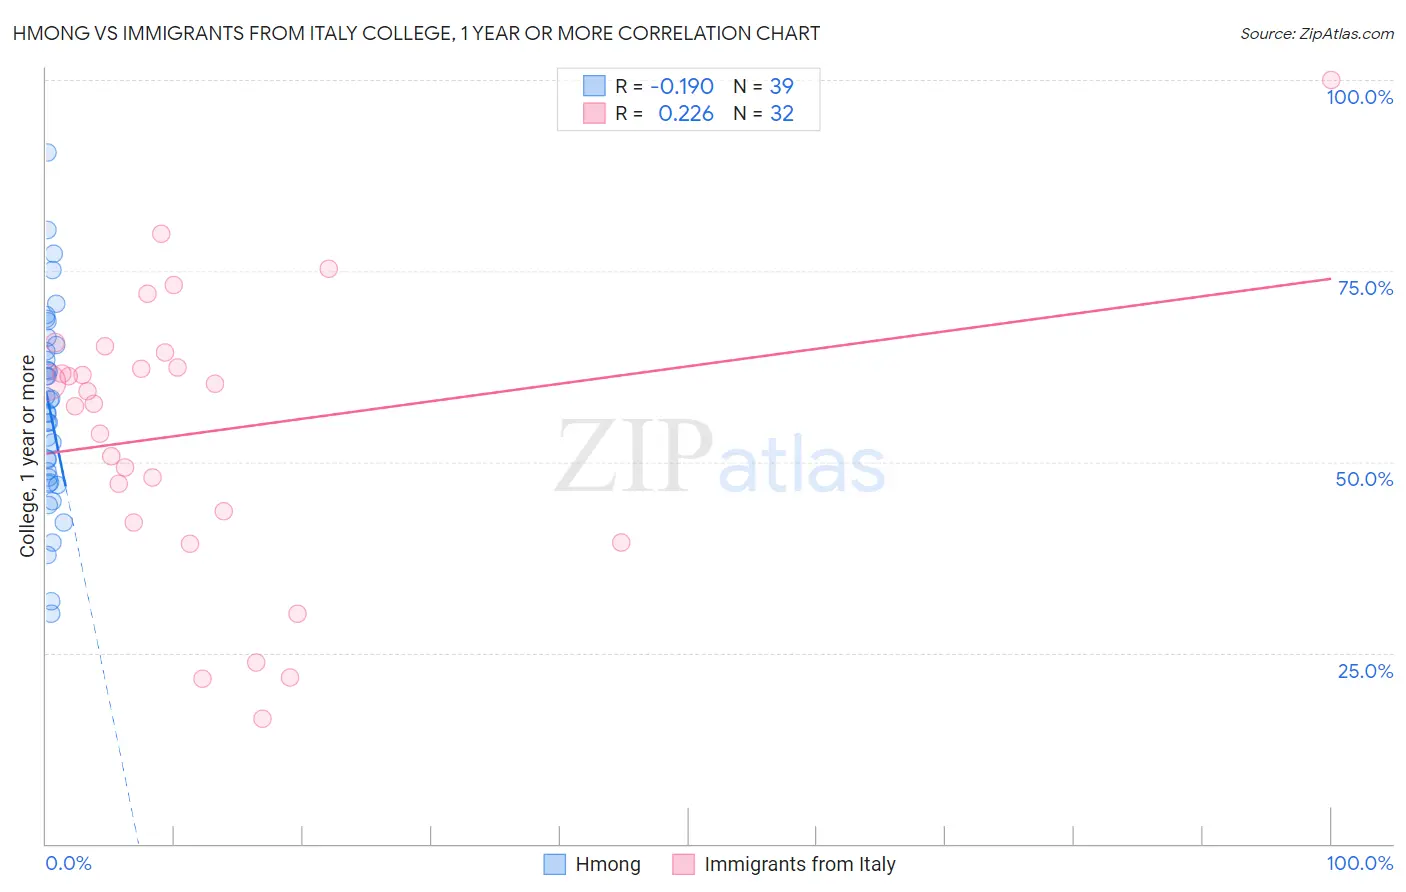
Hmong vs Immigrants from Italy College, 1 year or more Correlation Chart
The statistical analysis conducted on geographies consisting of 24,680,511 people shows a poor negative correlation between the proportion of Hmong and percentage of population with at least college, 1 year or more education in the United States with a correlation coefficient (R) of -0.190 and weighted average of 57.2%. Similarly, the statistical analysis conducted on geographies consisting of 324,223,988 people shows a weak positive correlation between the proportion of Immigrants from Italy and percentage of population with at least college, 1 year or more education in the United States with a correlation coefficient (R) of 0.226 and weighted average of 61.2%, a difference of 7.2%.
College, 1 year or more Correlation Summary
| Measurement | Hmong | Immigrants from Italy |
| Minimum | 30.1% | 16.4% |
| Maximum | 90.4% | 100.0% |
| Range | 60.4% | 83.6% |
| Mean | 56.9% | 53.9% |
| Median | 56.5% | 58.4% |
| Interquartile 25% (IQ1) | 47.3% | 42.8% |
| Interquartile 75% (IQ3) | 65.3% | 63.3% |
| Interquartile Range (IQR) | 18.0% | 20.4% |
| Standard Deviation (Sample) | 13.1% | 18.4% |
| Standard Deviation (Population) | 12.9% | 18.1% |
Similar Demographics by College, 1 year or more
Demographics Similar to Hmong by College, 1 year or more
In terms of college, 1 year or more, the demographic groups most similar to Hmong are Portuguese (57.2%, a difference of 0.0%), Subsaharan African (57.3%, a difference of 0.17%), Vietnamese (57.0%, a difference of 0.21%), Immigrants from Western Africa (57.0%, a difference of 0.23%), and Immigrants (57.0%, a difference of 0.30%).
| Demographics | Rating | Rank | College, 1 year or more |
| Immigrants | Panama | 9.1 /100 | #217 | Tragic 57.6% |
| Native Hawaiians | 9.0 /100 | #218 | Tragic 57.6% |
| Whites/Caucasians | 8.7 /100 | #219 | Tragic 57.6% |
| Immigrants | Costa Rica | 8.0 /100 | #220 | Tragic 57.5% |
| Immigrants | Ghana | 7.7 /100 | #221 | Tragic 57.4% |
| Sub-Saharan Africans | 6.1 /100 | #222 | Tragic 57.3% |
| Portuguese | 5.4 /100 | #223 | Tragic 57.2% |
| Hmong | 5.4 /100 | #224 | Tragic 57.2% |
| Vietnamese | 4.7 /100 | #225 | Tragic 57.0% |
| Immigrants | Western Africa | 4.6 /100 | #226 | Tragic 57.0% |
| Immigrants | Immigrants | 4.4 /100 | #227 | Tragic 57.0% |
| Immigrants | Fiji | 4.0 /100 | #228 | Tragic 56.9% |
| Cree | 3.6 /100 | #229 | Tragic 56.8% |
| Liberians | 3.1 /100 | #230 | Tragic 56.7% |
| Immigrants | Burma/Myanmar | 2.7 /100 | #231 | Tragic 56.6% |
Demographics Similar to Immigrants from Italy by College, 1 year or more
In terms of college, 1 year or more, the demographic groups most similar to Immigrants from Italy are Immigrants from Eastern Africa (61.2%, a difference of 0.0%), Alsatian (61.3%, a difference of 0.030%), Ugandan (61.2%, a difference of 0.060%), Immigrants from Syria (61.3%, a difference of 0.080%), and Venezuelan (61.3%, a difference of 0.16%).
| Demographics | Rating | Rank | College, 1 year or more |
| Immigrants | Jordan | 92.7 /100 | #121 | Exceptional 61.4% |
| Immigrants | Chile | 92.3 /100 | #122 | Exceptional 61.4% |
| Serbians | 92.2 /100 | #123 | Exceptional 61.4% |
| Venezuelans | 92.1 /100 | #124 | Exceptional 61.3% |
| Immigrants | Syria | 91.6 /100 | #125 | Exceptional 61.3% |
| Alsatians | 91.3 /100 | #126 | Exceptional 61.3% |
| Immigrants | Eastern Africa | 91.1 /100 | #127 | Exceptional 61.2% |
| Immigrants | Italy | 91.1 /100 | #128 | Exceptional 61.2% |
| Ugandans | 90.7 /100 | #129 | Exceptional 61.2% |
| Italians | 89.5 /100 | #130 | Excellent 61.1% |
| Immigrants | Morocco | 89.5 /100 | #131 | Excellent 61.1% |
| Scandinavians | 88.2 /100 | #132 | Excellent 61.0% |
| Immigrants | Uzbekistan | 88.0 /100 | #133 | Excellent 61.0% |
| Immigrants | Venezuela | 87.9 /100 | #134 | Excellent 61.0% |
| Immigrants | Uganda | 87.4 /100 | #135 | Excellent 60.9% |