Hmong vs Dominican College, 1 year or more
COMPARE
Hmong
Dominican
College, 1 year or more
College, 1 year or more Comparison
Hmong
Dominicans
57.2%
COLLEGE, 1 YEAR OR MORE
5.4/ 100
METRIC RATING
224th/ 347
METRIC RANK
50.6%
COLLEGE, 1 YEAR OR MORE
0.0/ 100
METRIC RATING
326th/ 347
METRIC RANK
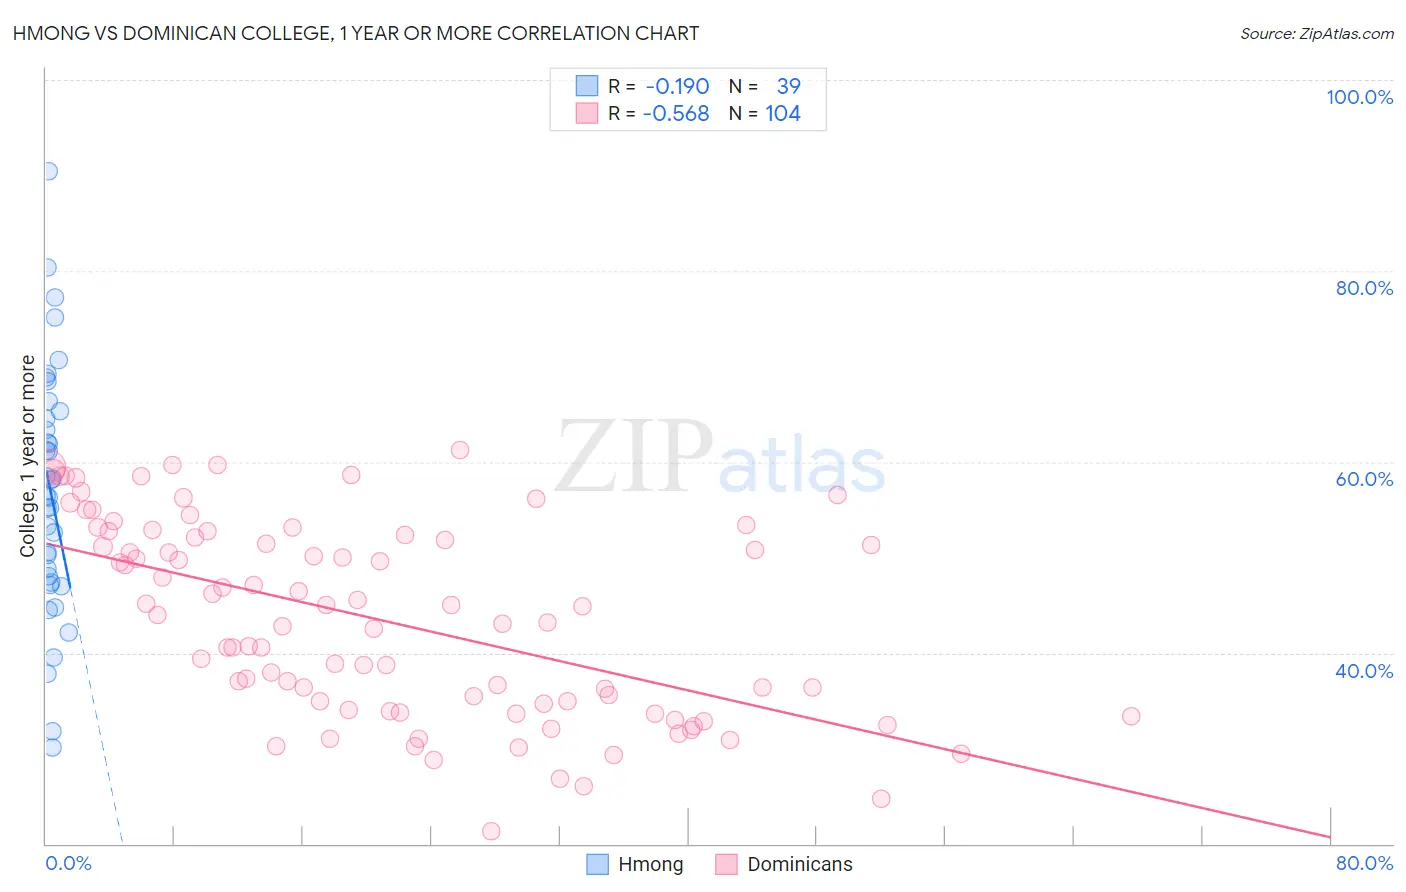
Hmong vs Dominican College, 1 year or more Correlation Chart
The statistical analysis conducted on geographies consisting of 24,680,511 people shows a poor negative correlation between the proportion of Hmong and percentage of population with at least college, 1 year or more education in the United States with a correlation coefficient (R) of -0.190 and weighted average of 57.2%. Similarly, the statistical analysis conducted on geographies consisting of 355,140,033 people shows a substantial negative correlation between the proportion of Dominicans and percentage of population with at least college, 1 year or more education in the United States with a correlation coefficient (R) of -0.568 and weighted average of 50.6%, a difference of 13.0%.
College, 1 year or more Correlation Summary
| Measurement | Hmong | Dominican |
| Minimum | 30.1% | 21.3% |
| Maximum | 90.4% | 61.3% |
| Range | 60.4% | 40.0% |
| Mean | 56.9% | 43.4% |
| Median | 56.5% | 43.6% |
| Interquartile 25% (IQ1) | 47.3% | 34.3% |
| Interquartile 75% (IQ3) | 65.3% | 52.2% |
| Interquartile Range (IQR) | 18.0% | 17.8% |
| Standard Deviation (Sample) | 13.1% | 10.1% |
| Standard Deviation (Population) | 12.9% | 10.1% |
Similar Demographics by College, 1 year or more
Demographics Similar to Hmong by College, 1 year or more
In terms of college, 1 year or more, the demographic groups most similar to Hmong are Portuguese (57.2%, a difference of 0.0%), Subsaharan African (57.3%, a difference of 0.17%), Vietnamese (57.0%, a difference of 0.21%), Immigrants from Western Africa (57.0%, a difference of 0.23%), and Immigrants (57.0%, a difference of 0.30%).
| Demographics | Rating | Rank | College, 1 year or more |
| Immigrants | Panama | 9.1 /100 | #217 | Tragic 57.6% |
| Native Hawaiians | 9.0 /100 | #218 | Tragic 57.6% |
| Whites/Caucasians | 8.7 /100 | #219 | Tragic 57.6% |
| Immigrants | Costa Rica | 8.0 /100 | #220 | Tragic 57.5% |
| Immigrants | Ghana | 7.7 /100 | #221 | Tragic 57.4% |
| Sub-Saharan Africans | 6.1 /100 | #222 | Tragic 57.3% |
| Portuguese | 5.4 /100 | #223 | Tragic 57.2% |
| Hmong | 5.4 /100 | #224 | Tragic 57.2% |
| Vietnamese | 4.7 /100 | #225 | Tragic 57.0% |
| Immigrants | Western Africa | 4.6 /100 | #226 | Tragic 57.0% |
| Immigrants | Immigrants | 4.4 /100 | #227 | Tragic 57.0% |
| Immigrants | Fiji | 4.0 /100 | #228 | Tragic 56.9% |
| Cree | 3.6 /100 | #229 | Tragic 56.8% |
| Liberians | 3.1 /100 | #230 | Tragic 56.7% |
| Immigrants | Burma/Myanmar | 2.7 /100 | #231 | Tragic 56.6% |
Demographics Similar to Dominicans by College, 1 year or more
In terms of college, 1 year or more, the demographic groups most similar to Dominicans are Menominee (50.6%, a difference of 0.040%), Dutch West Indian (50.5%, a difference of 0.15%), Immigrants from Latin America (50.7%, a difference of 0.18%), Immigrants from Cuba (50.7%, a difference of 0.21%), and Immigrants from Guatemala (50.7%, a difference of 0.22%).
| Demographics | Rating | Rank | College, 1 year or more |
| Immigrants | El Salvador | 0.0 /100 | #319 | Tragic 51.0% |
| Kiowa | 0.0 /100 | #320 | Tragic 51.0% |
| Hopi | 0.0 /100 | #321 | Tragic 50.9% |
| Navajo | 0.0 /100 | #322 | Tragic 50.8% |
| Immigrants | Guatemala | 0.0 /100 | #323 | Tragic 50.7% |
| Immigrants | Cuba | 0.0 /100 | #324 | Tragic 50.7% |
| Immigrants | Latin America | 0.0 /100 | #325 | Tragic 50.7% |
| Dominicans | 0.0 /100 | #326 | Tragic 50.6% |
| Menominee | 0.0 /100 | #327 | Tragic 50.6% |
| Dutch West Indians | 0.0 /100 | #328 | Tragic 50.5% |
| Cape Verdeans | 0.0 /100 | #329 | Tragic 50.3% |
| Natives/Alaskans | 0.0 /100 | #330 | Tragic 50.2% |
| Immigrants | Yemen | 0.0 /100 | #331 | Tragic 50.0% |
| Mexicans | 0.0 /100 | #332 | Tragic 49.2% |
| Immigrants | Dominican Republic | 0.0 /100 | #333 | Tragic 49.1% |