Kenyan vs Crow College, 1 year or more
COMPARE
Kenyan
Crow
College, 1 year or more
College, 1 year or more Comparison
Kenyans
Crow
60.5%
COLLEGE, 1 YEAR OR MORE
79.0/ 100
METRIC RATING
148th/ 347
METRIC RANK
54.5%
COLLEGE, 1 YEAR OR MORE
0.2/ 100
METRIC RATING
270th/ 347
METRIC RANK
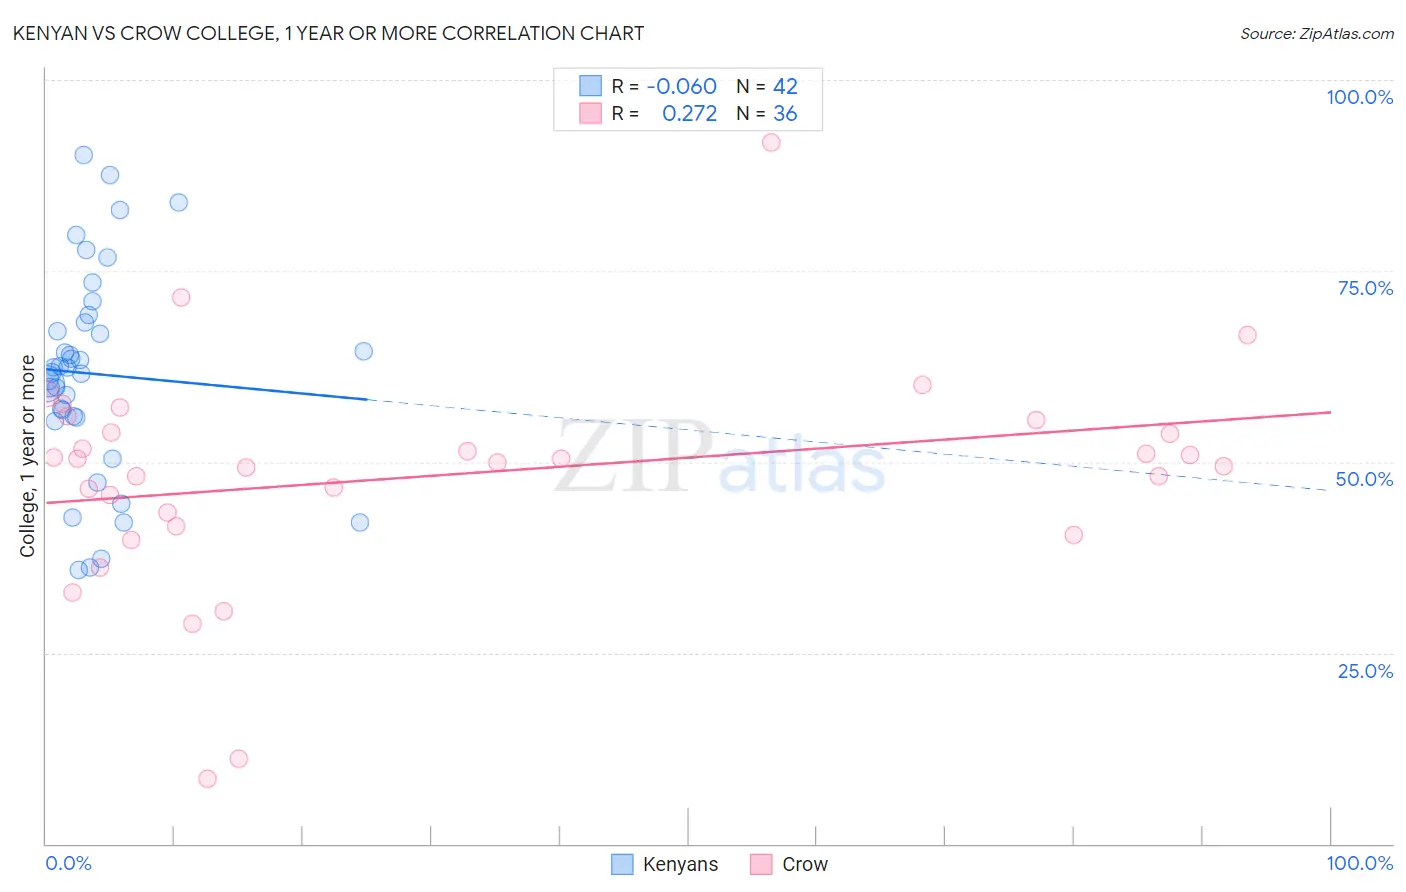
Kenyan vs Crow College, 1 year or more Correlation Chart
The statistical analysis conducted on geographies consisting of 168,244,481 people shows a slight negative correlation between the proportion of Kenyans and percentage of population with at least college, 1 year or more education in the United States with a correlation coefficient (R) of -0.060 and weighted average of 60.5%. Similarly, the statistical analysis conducted on geographies consisting of 59,209,980 people shows a weak positive correlation between the proportion of Crow and percentage of population with at least college, 1 year or more education in the United States with a correlation coefficient (R) of 0.272 and weighted average of 54.5%, a difference of 11.0%.
College, 1 year or more Correlation Summary
| Measurement | Kenyan | Crow |
| Minimum | 35.8% | 8.6% |
| Maximum | 90.2% | 91.8% |
| Range | 54.4% | 83.3% |
| Mean | 61.5% | 48.2% |
| Median | 62.0% | 50.2% |
| Interquartile 25% (IQ1) | 55.8% | 42.5% |
| Interquartile 75% (IQ3) | 68.3% | 54.7% |
| Interquartile Range (IQR) | 12.6% | 12.2% |
| Standard Deviation (Sample) | 13.5% | 14.8% |
| Standard Deviation (Population) | 13.4% | 14.6% |
Similar Demographics by College, 1 year or more
Demographics Similar to Kenyans by College, 1 year or more
In terms of college, 1 year or more, the demographic groups most similar to Kenyans are Brazilian (60.5%, a difference of 0.0%), Immigrants from Kenya (60.5%, a difference of 0.010%), Immigrants from Sudan (60.4%, a difference of 0.090%), Albanian (60.4%, a difference of 0.090%), and Scottish (60.5%, a difference of 0.10%).
| Demographics | Rating | Rank | College, 1 year or more |
| Immigrants | Afghanistan | 83.1 /100 | #141 | Excellent 60.7% |
| Poles | 82.8 /100 | #142 | Excellent 60.7% |
| Canadians | 82.7 /100 | #143 | Excellent 60.6% |
| Czechs | 81.9 /100 | #144 | Excellent 60.6% |
| Slavs | 81.1 /100 | #145 | Excellent 60.6% |
| Scottish | 80.2 /100 | #146 | Excellent 60.5% |
| Immigrants | Kenya | 79.1 /100 | #147 | Good 60.5% |
| Kenyans | 79.0 /100 | #148 | Good 60.5% |
| Brazilians | 79.0 /100 | #149 | Good 60.5% |
| Immigrants | Sudan | 77.8 /100 | #150 | Good 60.4% |
| Albanians | 77.8 /100 | #151 | Good 60.4% |
| Immigrants | Germany | 76.1 /100 | #152 | Good 60.3% |
| Sierra Leoneans | 74.1 /100 | #153 | Good 60.2% |
| Sudanese | 73.0 /100 | #154 | Good 60.2% |
| Moroccans | 72.9 /100 | #155 | Good 60.2% |
Demographics Similar to Crow by College, 1 year or more
In terms of college, 1 year or more, the demographic groups most similar to Crow are Bahamian (54.5%, a difference of 0.020%), Bangladeshi (54.5%, a difference of 0.030%), British West Indian (54.5%, a difference of 0.070%), Comanche (54.4%, a difference of 0.070%), and Immigrants from Grenada (54.4%, a difference of 0.11%).
| Demographics | Rating | Rank | College, 1 year or more |
| U.S. Virgin Islanders | 0.3 /100 | #263 | Tragic 54.8% |
| Immigrants | Micronesia | 0.3 /100 | #264 | Tragic 54.8% |
| Immigrants | Laos | 0.2 /100 | #265 | Tragic 54.7% |
| Potawatomi | 0.2 /100 | #266 | Tragic 54.6% |
| Blackfeet | 0.2 /100 | #267 | Tragic 54.6% |
| British West Indians | 0.2 /100 | #268 | Tragic 54.5% |
| Bangladeshis | 0.2 /100 | #269 | Tragic 54.5% |
| Crow | 0.2 /100 | #270 | Tragic 54.5% |
| Bahamians | 0.2 /100 | #271 | Tragic 54.5% |
| Comanche | 0.2 /100 | #272 | Tragic 54.4% |
| Immigrants | Grenada | 0.2 /100 | #273 | Tragic 54.4% |
| Belizeans | 0.2 /100 | #274 | Tragic 54.4% |
| Americans | 0.2 /100 | #275 | Tragic 54.4% |
| Shoshone | 0.2 /100 | #276 | Tragic 54.3% |
| Ecuadorians | 0.2 /100 | #277 | Tragic 54.3% |