Immigrants from Somalia vs Crow College, 1 year or more
COMPARE
Immigrants from Somalia
Crow
College, 1 year or more
College, 1 year or more Comparison
Immigrants from Somalia
Crow
59.7%
COLLEGE, 1 YEAR OR MORE
58.3/ 100
METRIC RATING
163rd/ 347
METRIC RANK
54.5%
COLLEGE, 1 YEAR OR MORE
0.2/ 100
METRIC RATING
270th/ 347
METRIC RANK
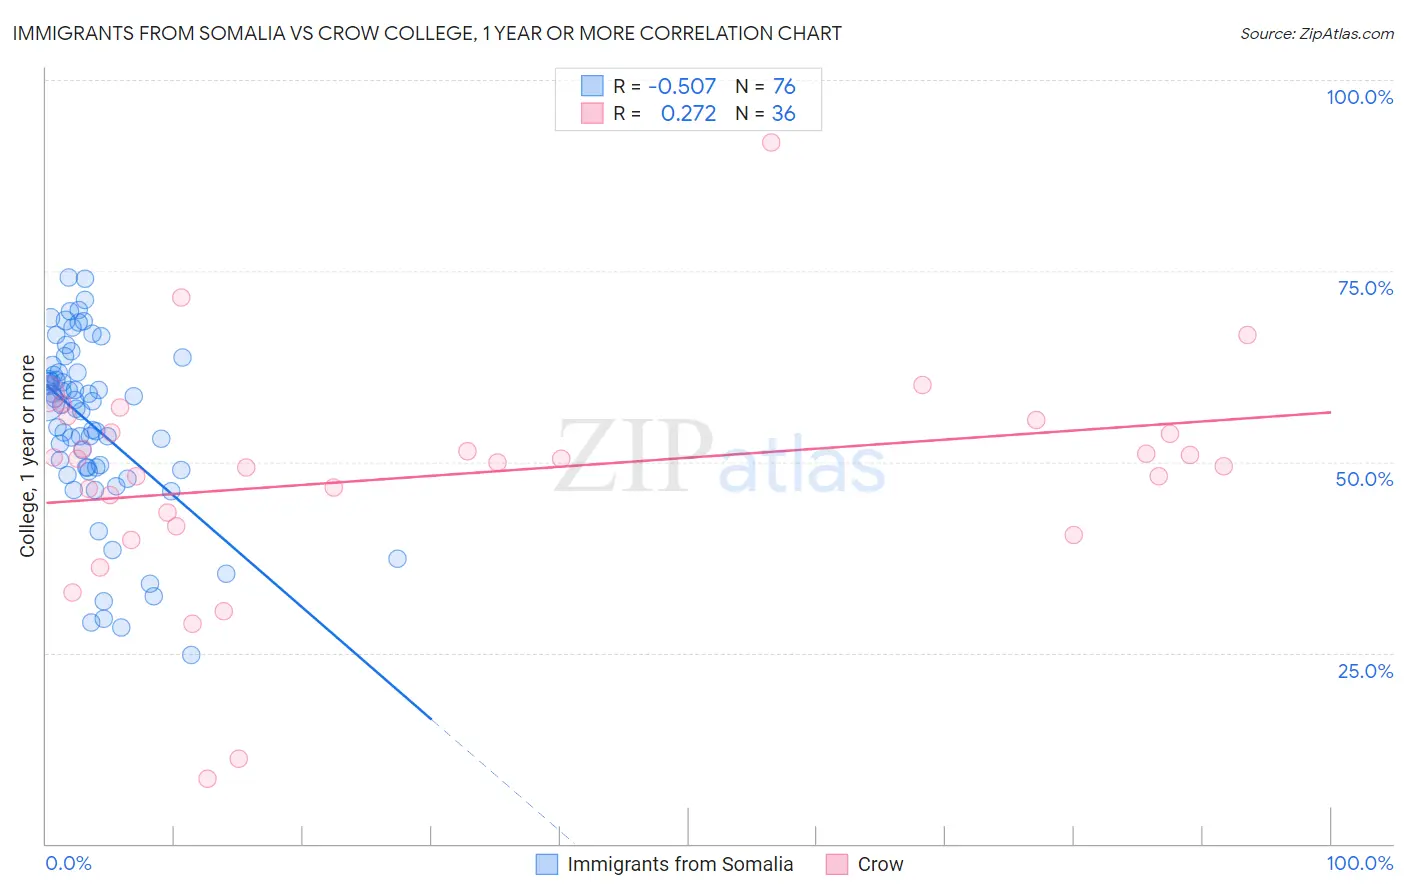
Immigrants from Somalia vs Crow College, 1 year or more Correlation Chart
The statistical analysis conducted on geographies consisting of 92,111,755 people shows a substantial negative correlation between the proportion of Immigrants from Somalia and percentage of population with at least college, 1 year or more education in the United States with a correlation coefficient (R) of -0.507 and weighted average of 59.7%. Similarly, the statistical analysis conducted on geographies consisting of 59,209,980 people shows a weak positive correlation between the proportion of Crow and percentage of population with at least college, 1 year or more education in the United States with a correlation coefficient (R) of 0.272 and weighted average of 54.5%, a difference of 9.5%.
College, 1 year or more Correlation Summary
| Measurement | Immigrants from Somalia | Crow |
| Minimum | 24.7% | 8.6% |
| Maximum | 74.1% | 91.8% |
| Range | 49.4% | 83.3% |
| Mean | 54.7% | 48.2% |
| Median | 57.6% | 50.2% |
| Interquartile 25% (IQ1) | 49.0% | 42.5% |
| Interquartile 75% (IQ3) | 61.7% | 54.7% |
| Interquartile Range (IQR) | 12.7% | 12.2% |
| Standard Deviation (Sample) | 11.5% | 14.8% |
| Standard Deviation (Population) | 11.4% | 14.6% |
Similar Demographics by College, 1 year or more
Demographics Similar to Immigrants from Somalia by College, 1 year or more
In terms of college, 1 year or more, the demographic groups most similar to Immigrants from Somalia are Korean (59.7%, a difference of 0.010%), Belgian (59.7%, a difference of 0.010%), Irish (59.6%, a difference of 0.12%), Immigrants from Africa (59.6%, a difference of 0.12%), and Immigrants from North Macedonia (59.5%, a difference of 0.28%).
| Demographics | Rating | Rank | College, 1 year or more |
| Finns | 72.9 /100 | #156 | Good 60.2% |
| Immigrants | Armenia | 68.8 /100 | #157 | Good 60.0% |
| English | 67.2 /100 | #158 | Good 60.0% |
| Immigrants | Iraq | 67.0 /100 | #159 | Good 60.0% |
| South American Indians | 66.9 /100 | #160 | Good 60.0% |
| Somalis | 64.5 /100 | #161 | Good 59.9% |
| Koreans | 58.5 /100 | #162 | Average 59.7% |
| Immigrants | Somalia | 58.3 /100 | #163 | Average 59.7% |
| Belgians | 58.1 /100 | #164 | Average 59.7% |
| Irish | 56.1 /100 | #165 | Average 59.6% |
| Immigrants | Africa | 56.1 /100 | #166 | Average 59.6% |
| Immigrants | North Macedonia | 53.1 /100 | #167 | Average 59.5% |
| Hungarians | 52.9 /100 | #168 | Average 59.5% |
| Immigrants | Southern Europe | 52.7 /100 | #169 | Average 59.5% |
| Welsh | 52.4 /100 | #170 | Average 59.5% |
Demographics Similar to Crow by College, 1 year or more
In terms of college, 1 year or more, the demographic groups most similar to Crow are Bahamian (54.5%, a difference of 0.020%), Bangladeshi (54.5%, a difference of 0.030%), British West Indian (54.5%, a difference of 0.070%), Comanche (54.4%, a difference of 0.070%), and Immigrants from Grenada (54.4%, a difference of 0.11%).
| Demographics | Rating | Rank | College, 1 year or more |
| U.S. Virgin Islanders | 0.3 /100 | #263 | Tragic 54.8% |
| Immigrants | Micronesia | 0.3 /100 | #264 | Tragic 54.8% |
| Immigrants | Laos | 0.2 /100 | #265 | Tragic 54.7% |
| Potawatomi | 0.2 /100 | #266 | Tragic 54.6% |
| Blackfeet | 0.2 /100 | #267 | Tragic 54.6% |
| British West Indians | 0.2 /100 | #268 | Tragic 54.5% |
| Bangladeshis | 0.2 /100 | #269 | Tragic 54.5% |
| Crow | 0.2 /100 | #270 | Tragic 54.5% |
| Bahamians | 0.2 /100 | #271 | Tragic 54.5% |
| Comanche | 0.2 /100 | #272 | Tragic 54.4% |
| Immigrants | Grenada | 0.2 /100 | #273 | Tragic 54.4% |
| Belizeans | 0.2 /100 | #274 | Tragic 54.4% |
| Americans | 0.2 /100 | #275 | Tragic 54.4% |
| Shoshone | 0.2 /100 | #276 | Tragic 54.3% |
| Ecuadorians | 0.2 /100 | #277 | Tragic 54.3% |