Burmese vs Crow College, 1 year or more
COMPARE
Burmese
Crow
College, 1 year or more
College, 1 year or more Comparison
Burmese
Crow
66.7%
COLLEGE, 1 YEAR OR MORE
100.0/ 100
METRIC RATING
14th/ 347
METRIC RANK
54.5%
COLLEGE, 1 YEAR OR MORE
0.2/ 100
METRIC RATING
270th/ 347
METRIC RANK
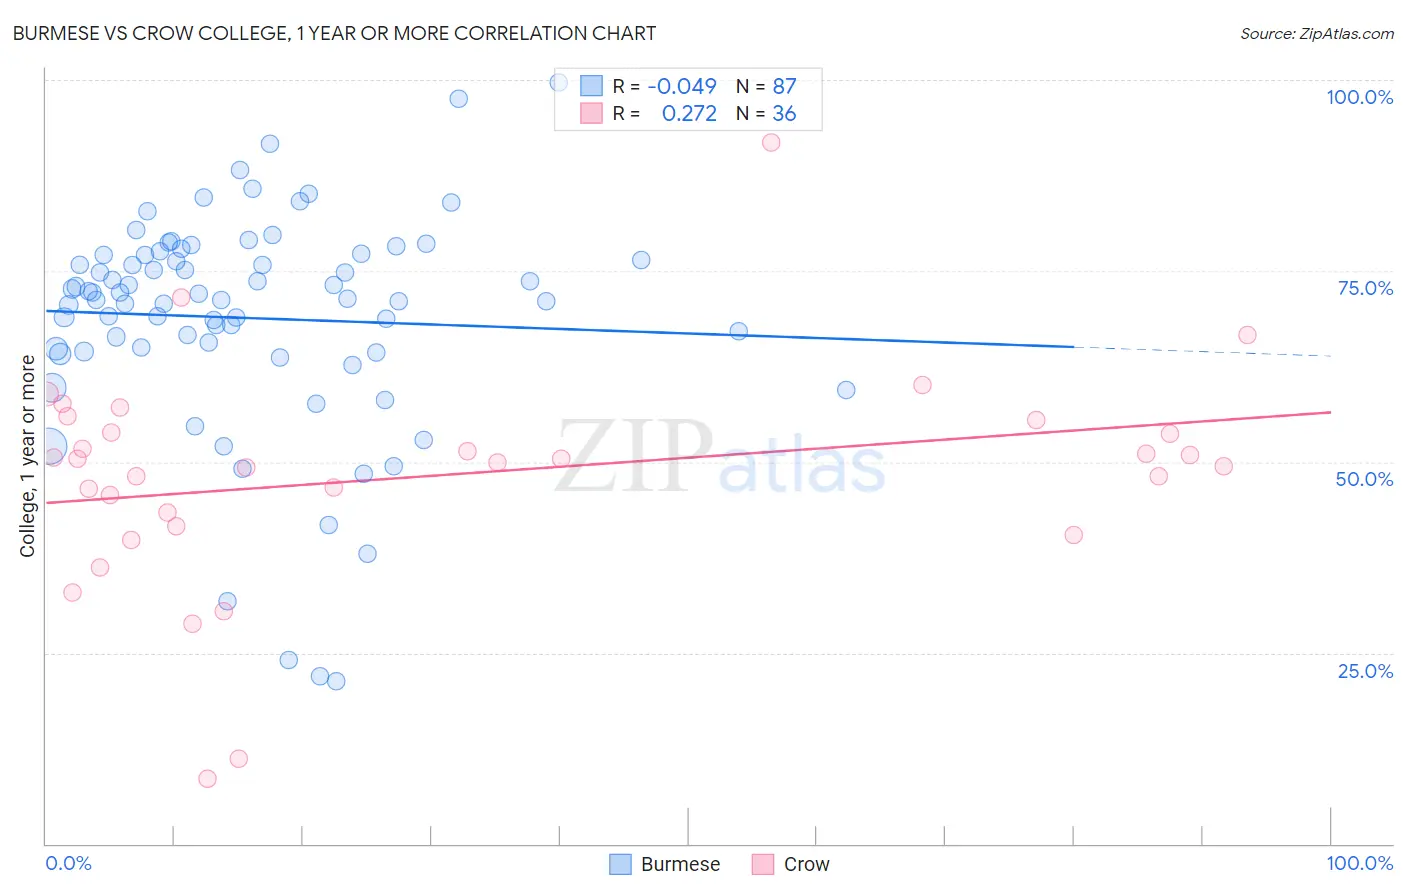
Burmese vs Crow College, 1 year or more Correlation Chart
The statistical analysis conducted on geographies consisting of 465,403,137 people shows no correlation between the proportion of Burmese and percentage of population with at least college, 1 year or more education in the United States with a correlation coefficient (R) of -0.049 and weighted average of 66.7%. Similarly, the statistical analysis conducted on geographies consisting of 59,209,980 people shows a weak positive correlation between the proportion of Crow and percentage of population with at least college, 1 year or more education in the United States with a correlation coefficient (R) of 0.272 and weighted average of 54.5%, a difference of 22.4%.
College, 1 year or more Correlation Summary
| Measurement | Burmese | Crow |
| Minimum | 21.2% | 8.6% |
| Maximum | 99.6% | 91.8% |
| Range | 78.4% | 83.3% |
| Mean | 68.8% | 48.2% |
| Median | 71.4% | 50.2% |
| Interquartile 25% (IQ1) | 64.5% | 42.5% |
| Interquartile 75% (IQ3) | 77.0% | 54.7% |
| Interquartile Range (IQR) | 12.6% | 12.2% |
| Standard Deviation (Sample) | 14.6% | 14.8% |
| Standard Deviation (Population) | 14.5% | 14.6% |
Similar Demographics by College, 1 year or more
Demographics Similar to Burmese by College, 1 year or more
In terms of college, 1 year or more, the demographic groups most similar to Burmese are Cambodian (66.7%, a difference of 0.0%), Immigrants from Japan (66.7%, a difference of 0.040%), Immigrants from Eastern Asia (66.6%, a difference of 0.15%), Immigrants from Sweden (66.8%, a difference of 0.19%), and Eastern European (66.6%, a difference of 0.22%).
| Demographics | Rating | Rank | College, 1 year or more |
| Okinawans | 100.0 /100 | #7 | Exceptional 69.0% |
| Thais | 100.0 /100 | #8 | Exceptional 68.6% |
| Immigrants | Israel | 100.0 /100 | #9 | Exceptional 67.8% |
| Immigrants | Australia | 100.0 /100 | #10 | Exceptional 67.7% |
| Immigrants | South Central Asia | 100.0 /100 | #11 | Exceptional 67.1% |
| Cypriots | 100.0 /100 | #12 | Exceptional 67.0% |
| Immigrants | Sweden | 100.0 /100 | #13 | Exceptional 66.8% |
| Burmese | 100.0 /100 | #14 | Exceptional 66.7% |
| Cambodians | 100.0 /100 | #15 | Exceptional 66.7% |
| Immigrants | Japan | 100.0 /100 | #16 | Exceptional 66.7% |
| Immigrants | Eastern Asia | 100.0 /100 | #17 | Exceptional 66.6% |
| Eastern Europeans | 100.0 /100 | #18 | Exceptional 66.6% |
| Immigrants | Switzerland | 100.0 /100 | #19 | Exceptional 66.5% |
| Immigrants | Korea | 100.0 /100 | #20 | Exceptional 66.5% |
| Immigrants | Hong Kong | 100.0 /100 | #21 | Exceptional 66.4% |
Demographics Similar to Crow by College, 1 year or more
In terms of college, 1 year or more, the demographic groups most similar to Crow are Bahamian (54.5%, a difference of 0.020%), Bangladeshi (54.5%, a difference of 0.030%), British West Indian (54.5%, a difference of 0.070%), Comanche (54.4%, a difference of 0.070%), and Immigrants from Grenada (54.4%, a difference of 0.11%).
| Demographics | Rating | Rank | College, 1 year or more |
| U.S. Virgin Islanders | 0.3 /100 | #263 | Tragic 54.8% |
| Immigrants | Micronesia | 0.3 /100 | #264 | Tragic 54.8% |
| Immigrants | Laos | 0.2 /100 | #265 | Tragic 54.7% |
| Potawatomi | 0.2 /100 | #266 | Tragic 54.6% |
| Blackfeet | 0.2 /100 | #267 | Tragic 54.6% |
| British West Indians | 0.2 /100 | #268 | Tragic 54.5% |
| Bangladeshis | 0.2 /100 | #269 | Tragic 54.5% |
| Crow | 0.2 /100 | #270 | Tragic 54.5% |
| Bahamians | 0.2 /100 | #271 | Tragic 54.5% |
| Comanche | 0.2 /100 | #272 | Tragic 54.4% |
| Immigrants | Grenada | 0.2 /100 | #273 | Tragic 54.4% |
| Belizeans | 0.2 /100 | #274 | Tragic 54.4% |
| Americans | 0.2 /100 | #275 | Tragic 54.4% |
| Shoshone | 0.2 /100 | #276 | Tragic 54.3% |
| Ecuadorians | 0.2 /100 | #277 | Tragic 54.3% |