Kenyan vs Immigrants from Somalia College, 1 year or more
COMPARE
Kenyan
Immigrants from Somalia
College, 1 year or more
College, 1 year or more Comparison
Kenyans
Immigrants from Somalia
60.5%
COLLEGE, 1 YEAR OR MORE
79.0/ 100
METRIC RATING
148th/ 347
METRIC RANK
59.7%
COLLEGE, 1 YEAR OR MORE
58.3/ 100
METRIC RATING
163rd/ 347
METRIC RANK
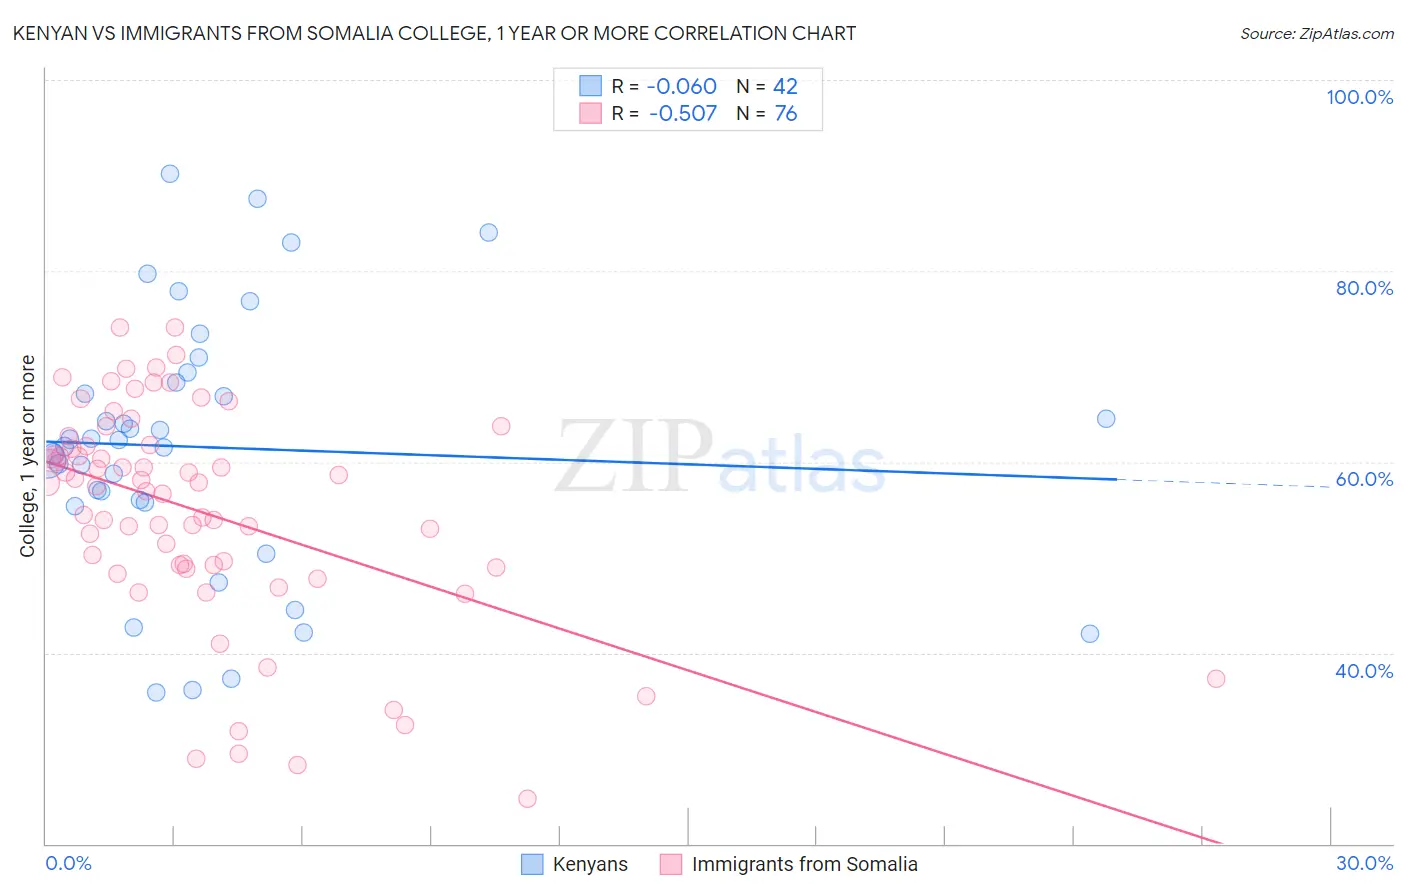
Kenyan vs Immigrants from Somalia College, 1 year or more Correlation Chart
The statistical analysis conducted on geographies consisting of 168,244,481 people shows a slight negative correlation between the proportion of Kenyans and percentage of population with at least college, 1 year or more education in the United States with a correlation coefficient (R) of -0.060 and weighted average of 60.5%. Similarly, the statistical analysis conducted on geographies consisting of 92,111,755 people shows a substantial negative correlation between the proportion of Immigrants from Somalia and percentage of population with at least college, 1 year or more education in the United States with a correlation coefficient (R) of -0.507 and weighted average of 59.7%, a difference of 1.3%.
College, 1 year or more Correlation Summary
| Measurement | Kenyan | Immigrants from Somalia |
| Minimum | 35.8% | 24.7% |
| Maximum | 90.2% | 74.1% |
| Range | 54.4% | 49.4% |
| Mean | 61.5% | 54.7% |
| Median | 62.0% | 57.6% |
| Interquartile 25% (IQ1) | 55.8% | 49.0% |
| Interquartile 75% (IQ3) | 68.3% | 61.7% |
| Interquartile Range (IQR) | 12.6% | 12.7% |
| Standard Deviation (Sample) | 13.5% | 11.5% |
| Standard Deviation (Population) | 13.4% | 11.4% |
Demographics Similar to Kenyans and Immigrants from Somalia by College, 1 year or more
In terms of college, 1 year or more, the demographic groups most similar to Kenyans are Brazilian (60.5%, a difference of 0.0%), Immigrants from Kenya (60.5%, a difference of 0.010%), Immigrants from Sudan (60.4%, a difference of 0.090%), Albanian (60.4%, a difference of 0.090%), and Scottish (60.5%, a difference of 0.10%). Similarly, the demographic groups most similar to Immigrants from Somalia are Korean (59.7%, a difference of 0.010%), Belgian (59.7%, a difference of 0.010%), Irish (59.6%, a difference of 0.12%), Somali (59.9%, a difference of 0.35%), and Immigrants from Iraq (60.0%, a difference of 0.49%).
| Demographics | Rating | Rank | College, 1 year or more |
| Slavs | 81.1 /100 | #145 | Excellent 60.6% |
| Scottish | 80.2 /100 | #146 | Excellent 60.5% |
| Immigrants | Kenya | 79.1 /100 | #147 | Good 60.5% |
| Kenyans | 79.0 /100 | #148 | Good 60.5% |
| Brazilians | 79.0 /100 | #149 | Good 60.5% |
| Immigrants | Sudan | 77.8 /100 | #150 | Good 60.4% |
| Albanians | 77.8 /100 | #151 | Good 60.4% |
| Immigrants | Germany | 76.1 /100 | #152 | Good 60.3% |
| Sierra Leoneans | 74.1 /100 | #153 | Good 60.2% |
| Sudanese | 73.0 /100 | #154 | Good 60.2% |
| Moroccans | 72.9 /100 | #155 | Good 60.2% |
| Finns | 72.9 /100 | #156 | Good 60.2% |
| Immigrants | Armenia | 68.8 /100 | #157 | Good 60.0% |
| English | 67.2 /100 | #158 | Good 60.0% |
| Immigrants | Iraq | 67.0 /100 | #159 | Good 60.0% |
| South American Indians | 66.9 /100 | #160 | Good 60.0% |
| Somalis | 64.5 /100 | #161 | Good 59.9% |
| Koreans | 58.5 /100 | #162 | Average 59.7% |
| Immigrants | Somalia | 58.3 /100 | #163 | Average 59.7% |
| Belgians | 58.1 /100 | #164 | Average 59.7% |
| Irish | 56.1 /100 | #165 | Average 59.6% |