Pakistani vs Crow College, 1 year or more
COMPARE
Pakistani
Crow
College, 1 year or more
College, 1 year or more Comparison
Pakistanis
Crow
61.5%
COLLEGE, 1 YEAR OR MORE
93.2/ 100
METRIC RATING
120th/ 347
METRIC RANK
54.5%
COLLEGE, 1 YEAR OR MORE
0.2/ 100
METRIC RATING
270th/ 347
METRIC RANK
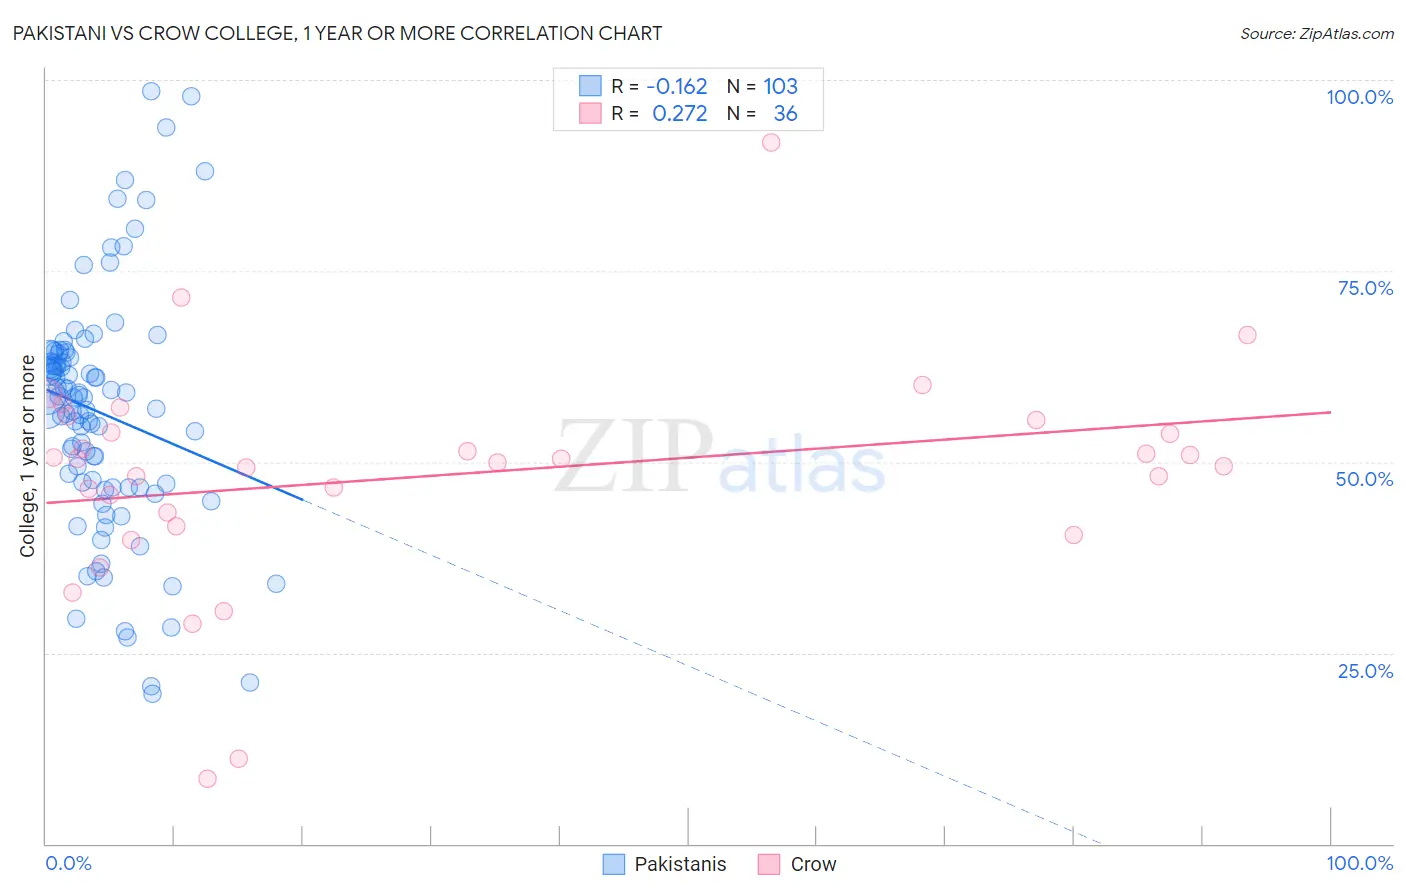
Pakistani vs Crow College, 1 year or more Correlation Chart
The statistical analysis conducted on geographies consisting of 335,356,650 people shows a poor negative correlation between the proportion of Pakistanis and percentage of population with at least college, 1 year or more education in the United States with a correlation coefficient (R) of -0.162 and weighted average of 61.5%. Similarly, the statistical analysis conducted on geographies consisting of 59,209,980 people shows a weak positive correlation between the proportion of Crow and percentage of population with at least college, 1 year or more education in the United States with a correlation coefficient (R) of 0.272 and weighted average of 54.5%, a difference of 12.8%.
College, 1 year or more Correlation Summary
| Measurement | Pakistani | Crow |
| Minimum | 19.6% | 8.6% |
| Maximum | 98.6% | 91.8% |
| Range | 79.0% | 83.3% |
| Mean | 56.5% | 48.2% |
| Median | 58.5% | 50.2% |
| Interquartile 25% (IQ1) | 46.7% | 42.5% |
| Interquartile 75% (IQ3) | 64.1% | 54.7% |
| Interquartile Range (IQR) | 17.4% | 12.2% |
| Standard Deviation (Sample) | 15.7% | 14.8% |
| Standard Deviation (Population) | 15.6% | 14.6% |
Similar Demographics by College, 1 year or more
Demographics Similar to Pakistanis by College, 1 year or more
In terms of college, 1 year or more, the demographic groups most similar to Pakistanis are Assyrian/Chaldean/Syriac (61.5%, a difference of 0.0%), Immigrants from Jordan (61.4%, a difference of 0.10%), Arab (61.6%, a difference of 0.14%), Immigrants from Brazil (61.6%, a difference of 0.14%), and Lebanese (61.6%, a difference of 0.18%).
| Demographics | Rating | Rank | College, 1 year or more |
| Ukrainians | 95.2 /100 | #113 | Exceptional 61.8% |
| Danes | 94.8 /100 | #114 | Exceptional 61.7% |
| Norwegians | 94.5 /100 | #115 | Exceptional 61.7% |
| Lebanese | 94.1 /100 | #116 | Exceptional 61.6% |
| Arabs | 93.9 /100 | #117 | Exceptional 61.6% |
| Immigrants | Brazil | 93.9 /100 | #118 | Exceptional 61.6% |
| Assyrians/Chaldeans/Syriacs | 93.3 /100 | #119 | Exceptional 61.5% |
| Pakistanis | 93.2 /100 | #120 | Exceptional 61.5% |
| Immigrants | Jordan | 92.7 /100 | #121 | Exceptional 61.4% |
| Immigrants | Chile | 92.3 /100 | #122 | Exceptional 61.4% |
| Serbians | 92.2 /100 | #123 | Exceptional 61.4% |
| Venezuelans | 92.1 /100 | #124 | Exceptional 61.3% |
| Immigrants | Syria | 91.6 /100 | #125 | Exceptional 61.3% |
| Alsatians | 91.3 /100 | #126 | Exceptional 61.3% |
| Immigrants | Eastern Africa | 91.1 /100 | #127 | Exceptional 61.2% |
Demographics Similar to Crow by College, 1 year or more
In terms of college, 1 year or more, the demographic groups most similar to Crow are Bahamian (54.5%, a difference of 0.020%), Bangladeshi (54.5%, a difference of 0.030%), British West Indian (54.5%, a difference of 0.070%), Comanche (54.4%, a difference of 0.070%), and Immigrants from Grenada (54.4%, a difference of 0.11%).
| Demographics | Rating | Rank | College, 1 year or more |
| U.S. Virgin Islanders | 0.3 /100 | #263 | Tragic 54.8% |
| Immigrants | Micronesia | 0.3 /100 | #264 | Tragic 54.8% |
| Immigrants | Laos | 0.2 /100 | #265 | Tragic 54.7% |
| Potawatomi | 0.2 /100 | #266 | Tragic 54.6% |
| Blackfeet | 0.2 /100 | #267 | Tragic 54.6% |
| British West Indians | 0.2 /100 | #268 | Tragic 54.5% |
| Bangladeshis | 0.2 /100 | #269 | Tragic 54.5% |
| Crow | 0.2 /100 | #270 | Tragic 54.5% |
| Bahamians | 0.2 /100 | #271 | Tragic 54.5% |
| Comanche | 0.2 /100 | #272 | Tragic 54.4% |
| Immigrants | Grenada | 0.2 /100 | #273 | Tragic 54.4% |
| Belizeans | 0.2 /100 | #274 | Tragic 54.4% |
| Americans | 0.2 /100 | #275 | Tragic 54.4% |
| Shoshone | 0.2 /100 | #276 | Tragic 54.3% |
| Ecuadorians | 0.2 /100 | #277 | Tragic 54.3% |