Immigrants from Caribbean vs Crow College, 1 year or more
COMPARE
Immigrants from Caribbean
Crow
College, 1 year or more
College, 1 year or more Comparison
Immigrants from Caribbean
Crow
51.4%
COLLEGE, 1 YEAR OR MORE
0.0/ 100
METRIC RATING
313th/ 347
METRIC RANK
54.5%
COLLEGE, 1 YEAR OR MORE
0.2/ 100
METRIC RATING
270th/ 347
METRIC RANK
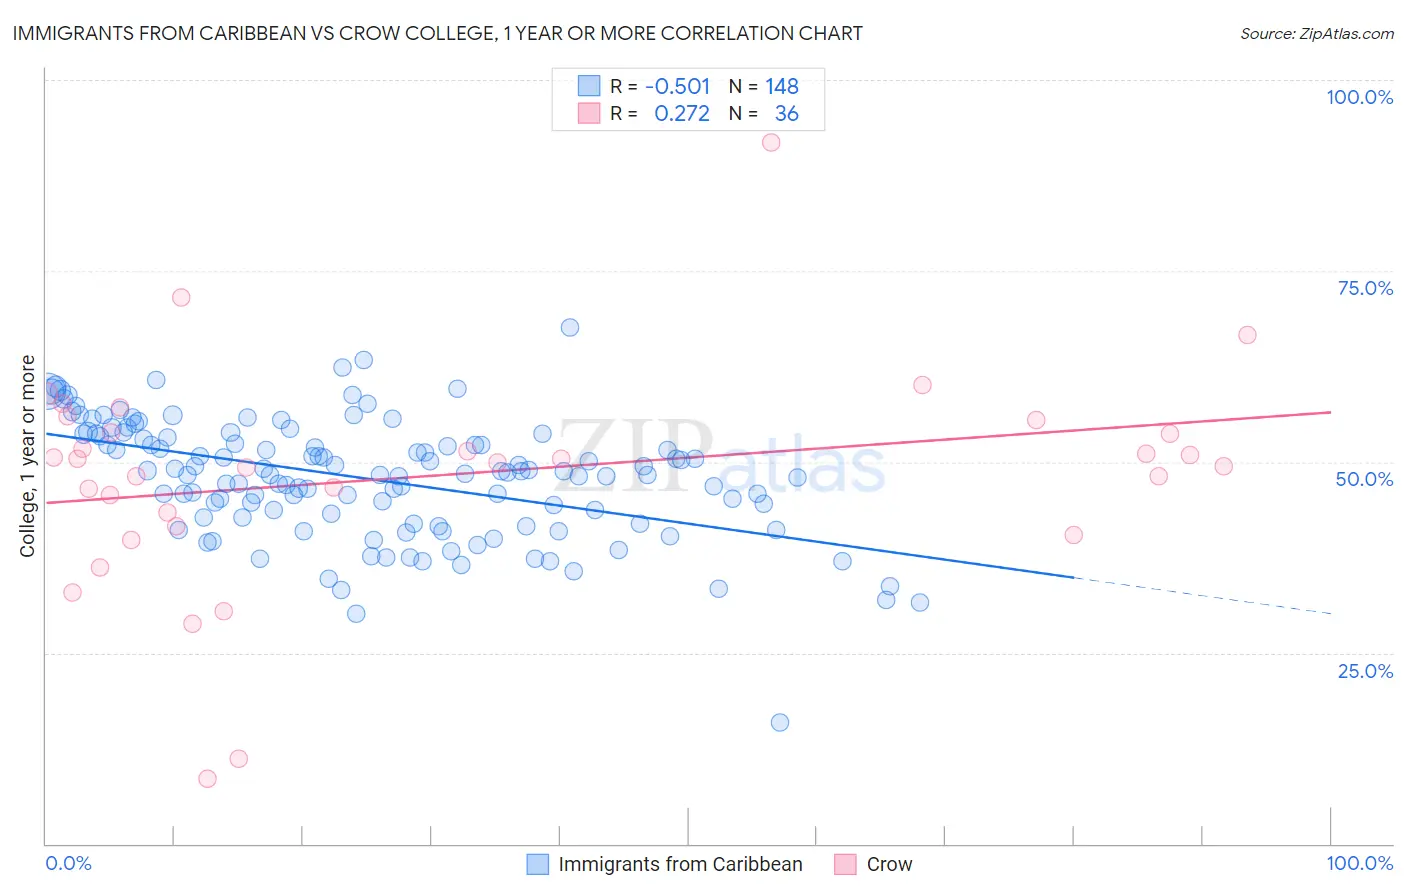
Immigrants from Caribbean vs Crow College, 1 year or more Correlation Chart
The statistical analysis conducted on geographies consisting of 450,060,902 people shows a substantial negative correlation between the proportion of Immigrants from Caribbean and percentage of population with at least college, 1 year or more education in the United States with a correlation coefficient (R) of -0.501 and weighted average of 51.4%. Similarly, the statistical analysis conducted on geographies consisting of 59,209,980 people shows a weak positive correlation between the proportion of Crow and percentage of population with at least college, 1 year or more education in the United States with a correlation coefficient (R) of 0.272 and weighted average of 54.5%, a difference of 5.9%.
College, 1 year or more Correlation Summary
| Measurement | Immigrants from Caribbean | Crow |
| Minimum | 15.9% | 8.6% |
| Maximum | 67.7% | 91.8% |
| Range | 51.8% | 83.3% |
| Mean | 47.8% | 48.2% |
| Median | 48.6% | 50.2% |
| Interquartile 25% (IQ1) | 42.7% | 42.5% |
| Interquartile 75% (IQ3) | 53.3% | 54.7% |
| Interquartile Range (IQR) | 10.6% | 12.2% |
| Standard Deviation (Sample) | 7.8% | 14.8% |
| Standard Deviation (Population) | 7.7% | 14.6% |
Similar Demographics by College, 1 year or more
Demographics Similar to Immigrants from Caribbean by College, 1 year or more
In terms of college, 1 year or more, the demographic groups most similar to Immigrants from Caribbean are Pueblo (51.5%, a difference of 0.13%), Immigrants from Haiti (51.5%, a difference of 0.17%), Fijian (51.3%, a difference of 0.22%), Honduran (51.6%, a difference of 0.33%), and Guatemalan (51.2%, a difference of 0.45%).
| Demographics | Rating | Rank | College, 1 year or more |
| Mexican American Indians | 0.0 /100 | #306 | Tragic 51.9% |
| Immigrants | Portugal | 0.0 /100 | #307 | Tragic 51.9% |
| Salvadorans | 0.0 /100 | #308 | Tragic 51.8% |
| Apache | 0.0 /100 | #309 | Tragic 51.8% |
| Hondurans | 0.0 /100 | #310 | Tragic 51.6% |
| Immigrants | Haiti | 0.0 /100 | #311 | Tragic 51.5% |
| Pueblo | 0.0 /100 | #312 | Tragic 51.5% |
| Immigrants | Caribbean | 0.0 /100 | #313 | Tragic 51.4% |
| Fijians | 0.0 /100 | #314 | Tragic 51.3% |
| Guatemalans | 0.0 /100 | #315 | Tragic 51.2% |
| Cajuns | 0.0 /100 | #316 | Tragic 51.2% |
| Hispanics or Latinos | 0.0 /100 | #317 | Tragic 51.1% |
| Immigrants | Honduras | 0.0 /100 | #318 | Tragic 51.0% |
| Immigrants | El Salvador | 0.0 /100 | #319 | Tragic 51.0% |
| Kiowa | 0.0 /100 | #320 | Tragic 51.0% |
Demographics Similar to Crow by College, 1 year or more
In terms of college, 1 year or more, the demographic groups most similar to Crow are Bahamian (54.5%, a difference of 0.020%), Bangladeshi (54.5%, a difference of 0.030%), British West Indian (54.5%, a difference of 0.070%), Comanche (54.4%, a difference of 0.070%), and Immigrants from Grenada (54.4%, a difference of 0.11%).
| Demographics | Rating | Rank | College, 1 year or more |
| U.S. Virgin Islanders | 0.3 /100 | #263 | Tragic 54.8% |
| Immigrants | Micronesia | 0.3 /100 | #264 | Tragic 54.8% |
| Immigrants | Laos | 0.2 /100 | #265 | Tragic 54.7% |
| Potawatomi | 0.2 /100 | #266 | Tragic 54.6% |
| Blackfeet | 0.2 /100 | #267 | Tragic 54.6% |
| British West Indians | 0.2 /100 | #268 | Tragic 54.5% |
| Bangladeshis | 0.2 /100 | #269 | Tragic 54.5% |
| Crow | 0.2 /100 | #270 | Tragic 54.5% |
| Bahamians | 0.2 /100 | #271 | Tragic 54.5% |
| Comanche | 0.2 /100 | #272 | Tragic 54.4% |
| Immigrants | Grenada | 0.2 /100 | #273 | Tragic 54.4% |
| Belizeans | 0.2 /100 | #274 | Tragic 54.4% |
| Americans | 0.2 /100 | #275 | Tragic 54.4% |
| Shoshone | 0.2 /100 | #276 | Tragic 54.3% |
| Ecuadorians | 0.2 /100 | #277 | Tragic 54.3% |