Chickasaw vs Crow College, 1 year or more
COMPARE
Chickasaw
Crow
College, 1 year or more
College, 1 year or more Comparison
Chickasaw
Crow
53.3%
COLLEGE, 1 YEAR OR MORE
0.0/ 100
METRIC RATING
292nd/ 347
METRIC RANK
54.5%
COLLEGE, 1 YEAR OR MORE
0.2/ 100
METRIC RATING
270th/ 347
METRIC RANK
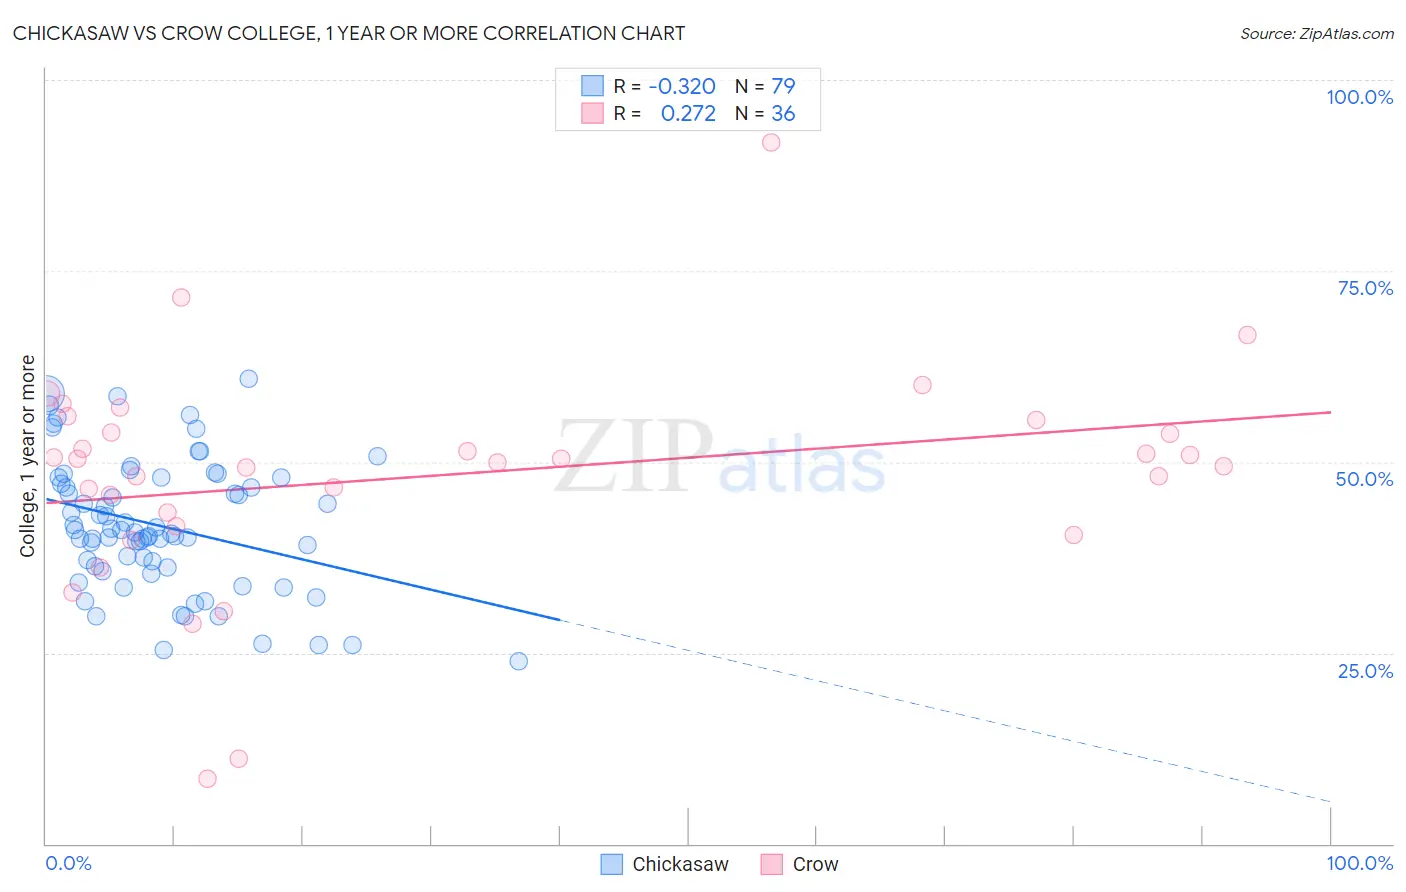
Chickasaw vs Crow College, 1 year or more Correlation Chart
The statistical analysis conducted on geographies consisting of 147,726,303 people shows a mild negative correlation between the proportion of Chickasaw and percentage of population with at least college, 1 year or more education in the United States with a correlation coefficient (R) of -0.320 and weighted average of 53.3%. Similarly, the statistical analysis conducted on geographies consisting of 59,209,980 people shows a weak positive correlation between the proportion of Crow and percentage of population with at least college, 1 year or more education in the United States with a correlation coefficient (R) of 0.272 and weighted average of 54.5%, a difference of 2.2%.
College, 1 year or more Correlation Summary
| Measurement | Chickasaw | Crow |
| Minimum | 23.9% | 8.6% |
| Maximum | 60.9% | 91.8% |
| Range | 37.0% | 83.3% |
| Mean | 41.6% | 48.2% |
| Median | 40.8% | 50.2% |
| Interquartile 25% (IQ1) | 36.2% | 42.5% |
| Interquartile 75% (IQ3) | 48.0% | 54.7% |
| Interquartile Range (IQR) | 11.8% | 12.2% |
| Standard Deviation (Sample) | 8.6% | 14.8% |
| Standard Deviation (Population) | 8.5% | 14.6% |
Similar Demographics by College, 1 year or more
Demographics Similar to Chickasaw by College, 1 year or more
In terms of college, 1 year or more, the demographic groups most similar to Chickasaw are Black/African American (53.3%, a difference of 0.020%), Cuban (53.4%, a difference of 0.13%), Alaskan Athabascan (53.4%, a difference of 0.18%), Alaska Native (53.4%, a difference of 0.20%), and Immigrants from Ecuador (53.4%, a difference of 0.20%).
| Demographics | Rating | Rank | College, 1 year or more |
| Immigrants | Guyana | 0.1 /100 | #285 | Tragic 53.5% |
| Central American Indians | 0.1 /100 | #286 | Tragic 53.5% |
| Immigrants | Belize | 0.1 /100 | #287 | Tragic 53.5% |
| Alaska Natives | 0.0 /100 | #288 | Tragic 53.4% |
| Immigrants | Ecuador | 0.0 /100 | #289 | Tragic 53.4% |
| Alaskan Athabascans | 0.0 /100 | #290 | Tragic 53.4% |
| Cubans | 0.0 /100 | #291 | Tragic 53.4% |
| Chickasaw | 0.0 /100 | #292 | Tragic 53.3% |
| Blacks/African Americans | 0.0 /100 | #293 | Tragic 53.3% |
| Cherokee | 0.0 /100 | #294 | Tragic 53.2% |
| Yaqui | 0.0 /100 | #295 | Tragic 53.2% |
| Sioux | 0.0 /100 | #296 | Tragic 53.0% |
| Paiute | 0.0 /100 | #297 | Tragic 52.9% |
| Immigrants | Dominica | 0.0 /100 | #298 | Tragic 52.5% |
| Immigrants | Nicaragua | 0.0 /100 | #299 | Tragic 52.4% |
Demographics Similar to Crow by College, 1 year or more
In terms of college, 1 year or more, the demographic groups most similar to Crow are Bahamian (54.5%, a difference of 0.020%), Bangladeshi (54.5%, a difference of 0.030%), British West Indian (54.5%, a difference of 0.070%), Comanche (54.4%, a difference of 0.070%), and Immigrants from Grenada (54.4%, a difference of 0.11%).
| Demographics | Rating | Rank | College, 1 year or more |
| U.S. Virgin Islanders | 0.3 /100 | #263 | Tragic 54.8% |
| Immigrants | Micronesia | 0.3 /100 | #264 | Tragic 54.8% |
| Immigrants | Laos | 0.2 /100 | #265 | Tragic 54.7% |
| Potawatomi | 0.2 /100 | #266 | Tragic 54.6% |
| Blackfeet | 0.2 /100 | #267 | Tragic 54.6% |
| British West Indians | 0.2 /100 | #268 | Tragic 54.5% |
| Bangladeshis | 0.2 /100 | #269 | Tragic 54.5% |
| Crow | 0.2 /100 | #270 | Tragic 54.5% |
| Bahamians | 0.2 /100 | #271 | Tragic 54.5% |
| Comanche | 0.2 /100 | #272 | Tragic 54.4% |
| Immigrants | Grenada | 0.2 /100 | #273 | Tragic 54.4% |
| Belizeans | 0.2 /100 | #274 | Tragic 54.4% |
| Americans | 0.2 /100 | #275 | Tragic 54.4% |
| Shoshone | 0.2 /100 | #276 | Tragic 54.3% |
| Ecuadorians | 0.2 /100 | #277 | Tragic 54.3% |