Immigrants from Western Asia vs Crow College, 1 year or more
COMPARE
Immigrants from Western Asia
Crow
College, 1 year or more
College, 1 year or more Comparison
Immigrants from Western Asia
Crow
62.5%
COLLEGE, 1 YEAR OR MORE
97.9/ 100
METRIC RATING
90th/ 347
METRIC RANK
54.5%
COLLEGE, 1 YEAR OR MORE
0.2/ 100
METRIC RATING
270th/ 347
METRIC RANK
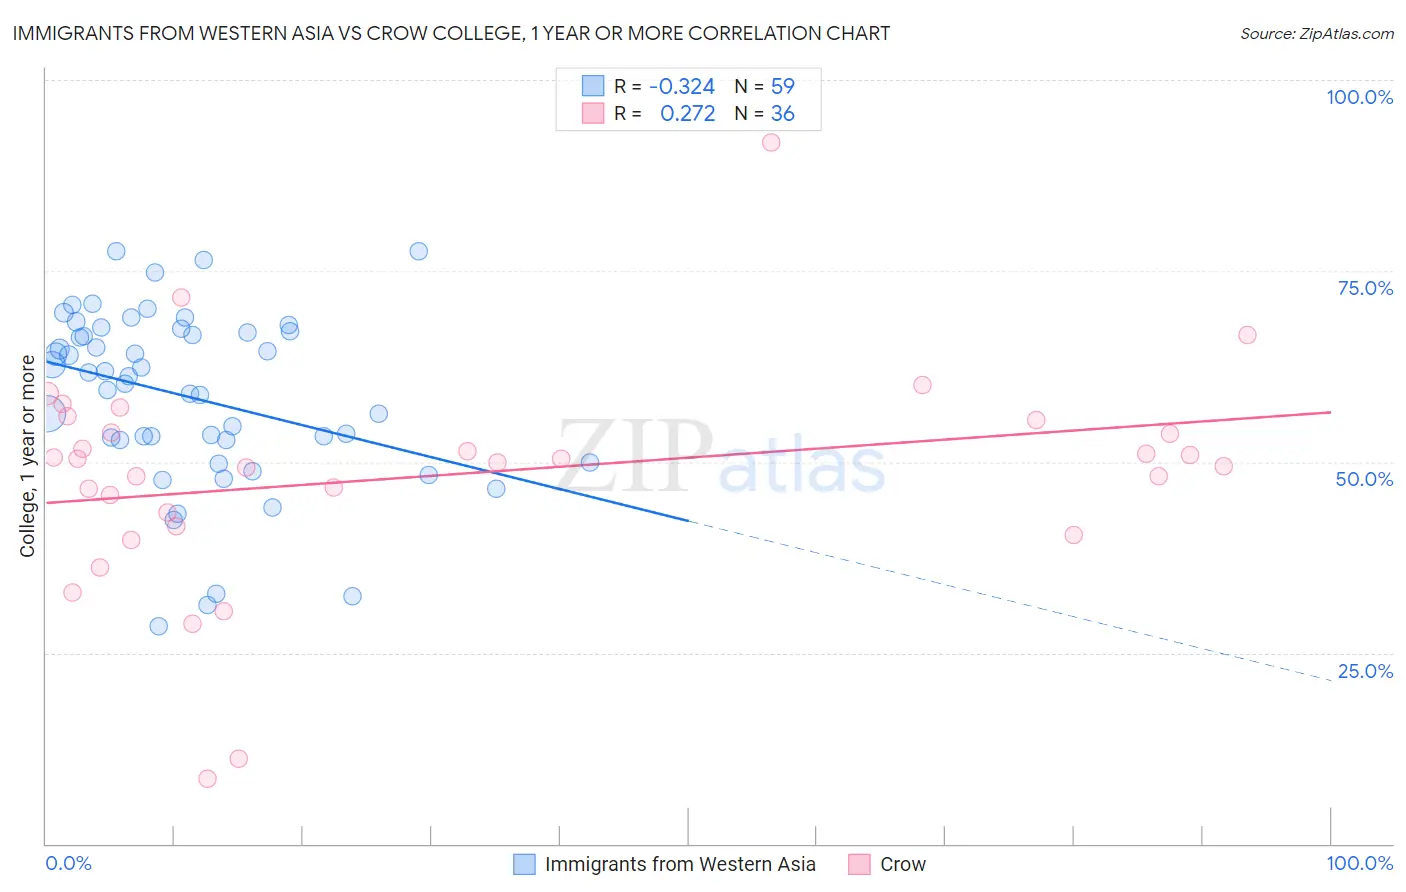
Immigrants from Western Asia vs Crow College, 1 year or more Correlation Chart
The statistical analysis conducted on geographies consisting of 404,433,351 people shows a mild negative correlation between the proportion of Immigrants from Western Asia and percentage of population with at least college, 1 year or more education in the United States with a correlation coefficient (R) of -0.324 and weighted average of 62.5%. Similarly, the statistical analysis conducted on geographies consisting of 59,209,980 people shows a weak positive correlation between the proportion of Crow and percentage of population with at least college, 1 year or more education in the United States with a correlation coefficient (R) of 0.272 and weighted average of 54.5%, a difference of 14.6%.
College, 1 year or more Correlation Summary
| Measurement | Immigrants from Western Asia | Crow |
| Minimum | 28.5% | 8.6% |
| Maximum | 77.6% | 91.8% |
| Range | 49.1% | 83.3% |
| Mean | 58.5% | 48.2% |
| Median | 61.2% | 50.2% |
| Interquartile 25% (IQ1) | 52.9% | 42.5% |
| Interquartile 75% (IQ3) | 67.1% | 54.7% |
| Interquartile Range (IQR) | 14.3% | 12.2% |
| Standard Deviation (Sample) | 11.5% | 14.8% |
| Standard Deviation (Population) | 11.4% | 14.6% |
Similar Demographics by College, 1 year or more
Demographics Similar to Immigrants from Western Asia by College, 1 year or more
In terms of college, 1 year or more, the demographic groups most similar to Immigrants from Western Asia are Immigrants from Eastern Europe (62.4%, a difference of 0.10%), Immigrants from Egypt (62.4%, a difference of 0.11%), Romanian (62.4%, a difference of 0.14%), Immigrants from Ethiopia (62.6%, a difference of 0.17%), and Immigrants from Croatia (62.3%, a difference of 0.20%).
| Demographics | Rating | Rank | College, 1 year or more |
| Immigrants | Argentina | 98.6 /100 | #83 | Exceptional 62.8% |
| Immigrants | England | 98.6 /100 | #84 | Exceptional 62.8% |
| Immigrants | Pakistan | 98.6 /100 | #85 | Exceptional 62.8% |
| Immigrants | Western Europe | 98.6 /100 | #86 | Exceptional 62.7% |
| Immigrants | Hungary | 98.6 /100 | #87 | Exceptional 62.7% |
| Greeks | 98.3 /100 | #88 | Exceptional 62.6% |
| Immigrants | Ethiopia | 98.2 /100 | #89 | Exceptional 62.6% |
| Immigrants | Western Asia | 97.9 /100 | #90 | Exceptional 62.5% |
| Immigrants | Eastern Europe | 97.8 /100 | #91 | Exceptional 62.4% |
| Immigrants | Egypt | 97.8 /100 | #92 | Exceptional 62.4% |
| Romanians | 97.7 /100 | #93 | Exceptional 62.4% |
| Immigrants | Croatia | 97.6 /100 | #94 | Exceptional 62.3% |
| British | 97.4 /100 | #95 | Exceptional 62.3% |
| Chinese | 97.2 /100 | #96 | Exceptional 62.2% |
| Jordanians | 97.2 /100 | #97 | Exceptional 62.2% |
Demographics Similar to Crow by College, 1 year or more
In terms of college, 1 year or more, the demographic groups most similar to Crow are Bahamian (54.5%, a difference of 0.020%), Bangladeshi (54.5%, a difference of 0.030%), British West Indian (54.5%, a difference of 0.070%), Comanche (54.4%, a difference of 0.070%), and Immigrants from Grenada (54.4%, a difference of 0.11%).
| Demographics | Rating | Rank | College, 1 year or more |
| U.S. Virgin Islanders | 0.3 /100 | #263 | Tragic 54.8% |
| Immigrants | Micronesia | 0.3 /100 | #264 | Tragic 54.8% |
| Immigrants | Laos | 0.2 /100 | #265 | Tragic 54.7% |
| Potawatomi | 0.2 /100 | #266 | Tragic 54.6% |
| Blackfeet | 0.2 /100 | #267 | Tragic 54.6% |
| British West Indians | 0.2 /100 | #268 | Tragic 54.5% |
| Bangladeshis | 0.2 /100 | #269 | Tragic 54.5% |
| Crow | 0.2 /100 | #270 | Tragic 54.5% |
| Bahamians | 0.2 /100 | #271 | Tragic 54.5% |
| Comanche | 0.2 /100 | #272 | Tragic 54.4% |
| Immigrants | Grenada | 0.2 /100 | #273 | Tragic 54.4% |
| Belizeans | 0.2 /100 | #274 | Tragic 54.4% |
| Americans | 0.2 /100 | #275 | Tragic 54.4% |
| Shoshone | 0.2 /100 | #276 | Tragic 54.3% |
| Ecuadorians | 0.2 /100 | #277 | Tragic 54.3% |