Kenyan vs Crow 11th Grade
COMPARE
Kenyan
Crow
11th Grade
11th Grade Comparison
Kenyans
Crow
92.9%
11TH GRADE
82.0/ 100
METRIC RATING
142nd/ 347
METRIC RANK
92.9%
11TH GRADE
84.1/ 100
METRIC RATING
139th/ 347
METRIC RANK
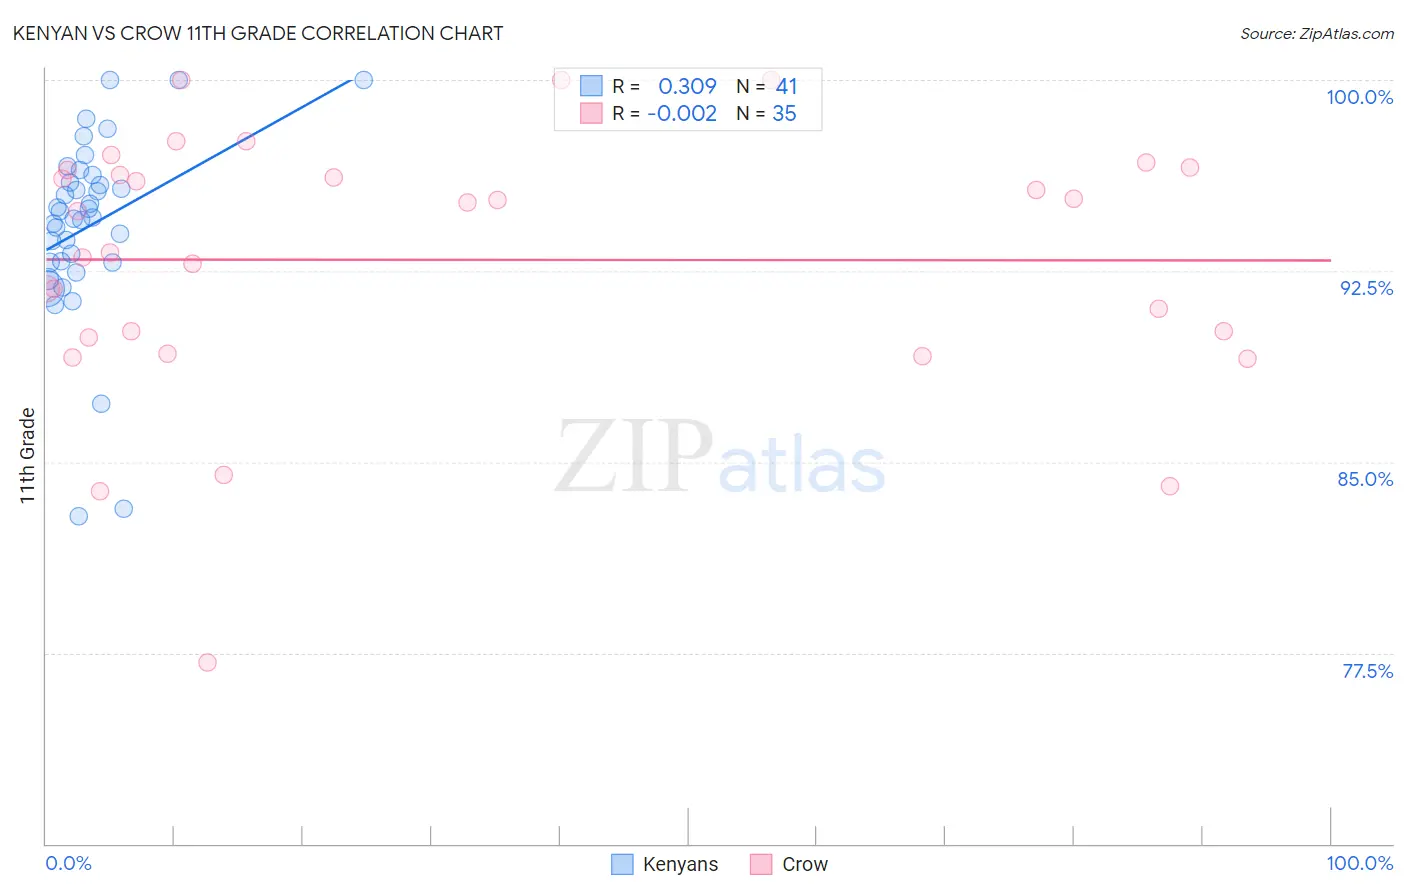
Kenyan vs Crow 11th Grade Correlation Chart
The statistical analysis conducted on geographies consisting of 168,244,042 people shows a mild positive correlation between the proportion of Kenyans and percentage of population with at least 11th grade education in the United States with a correlation coefficient (R) of 0.309 and weighted average of 92.9%. Similarly, the statistical analysis conducted on geographies consisting of 59,209,940 people shows no correlation between the proportion of Crow and percentage of population with at least 11th grade education in the United States with a correlation coefficient (R) of -0.002 and weighted average of 92.9%, a difference of 0.040%.
11th Grade Correlation Summary
| Measurement | Kenyan | Crow |
| Minimum | 82.9% | 77.1% |
| Maximum | 100.0% | 100.0% |
| Range | 17.1% | 22.9% |
| Mean | 94.3% | 92.9% |
| Median | 94.6% | 94.9% |
| Interquartile 25% (IQ1) | 92.8% | 89.9% |
| Interquartile 75% (IQ3) | 96.1% | 96.5% |
| Interquartile Range (IQR) | 3.3% | 6.6% |
| Standard Deviation (Sample) | 3.6% | 5.1% |
| Standard Deviation (Population) | 3.6% | 5.0% |
Demographics Similar to Kenyans and Crow by 11th Grade
In terms of 11th grade, the demographic groups most similar to Kenyans are Ugandan (92.9%, a difference of 0.010%), Venezuelan (92.9%, a difference of 0.020%), Chilean (92.9%, a difference of 0.020%), Assyrian/Chaldean/Syriac (92.8%, a difference of 0.030%), and Pakistani (92.8%, a difference of 0.040%). Similarly, the demographic groups most similar to Crow are Venezuelan (92.9%, a difference of 0.010%), Immigrants from Brazil (92.9%, a difference of 0.020%), Chilean (92.9%, a difference of 0.020%), Arab (92.9%, a difference of 0.030%), and Cree (92.9%, a difference of 0.040%).
| Demographics | Rating | Rank | 11th Grade |
| Albanians | 89.5 /100 | #130 | Excellent 93.0% |
| Egyptians | 89.5 /100 | #131 | Excellent 93.0% |
| Immigrants | Bosnia and Herzegovina | 89.0 /100 | #132 | Excellent 93.0% |
| Mongolians | 87.6 /100 | #133 | Excellent 93.0% |
| Delaware | 87.3 /100 | #134 | Excellent 93.0% |
| Immigrants | Italy | 86.6 /100 | #135 | Excellent 92.9% |
| Cree | 85.9 /100 | #136 | Excellent 92.9% |
| Arabs | 85.4 /100 | #137 | Excellent 92.9% |
| Immigrants | Brazil | 85.1 /100 | #138 | Excellent 92.9% |
| Crow | 84.1 /100 | #139 | Excellent 92.9% |
| Venezuelans | 83.4 /100 | #140 | Excellent 92.9% |
| Chileans | 83.0 /100 | #141 | Excellent 92.9% |
| Kenyans | 82.0 /100 | #142 | Excellent 92.9% |
| Ugandans | 81.4 /100 | #143 | Excellent 92.9% |
| Assyrians/Chaldeans/Syriacs | 80.5 /100 | #144 | Excellent 92.8% |
| Pakistanis | 79.6 /100 | #145 | Good 92.8% |
| Iroquois | 79.1 /100 | #146 | Good 92.8% |
| Immigrants | Kenya | 78.7 /100 | #147 | Good 92.8% |
| Hmong | 78.6 /100 | #148 | Good 92.8% |
| Immigrants | Poland | 78.5 /100 | #149 | Good 92.8% |
| Immigrants | Egypt | 77.5 /100 | #150 | Good 92.8% |