Mexican American Indian vs Crow College, 1 year or more
COMPARE
Mexican American Indian
Crow
College, 1 year or more
College, 1 year or more Comparison
Mexican American Indians
Crow
51.9%
COLLEGE, 1 YEAR OR MORE
0.0/ 100
METRIC RATING
306th/ 347
METRIC RANK
54.5%
COLLEGE, 1 YEAR OR MORE
0.2/ 100
METRIC RATING
270th/ 347
METRIC RANK
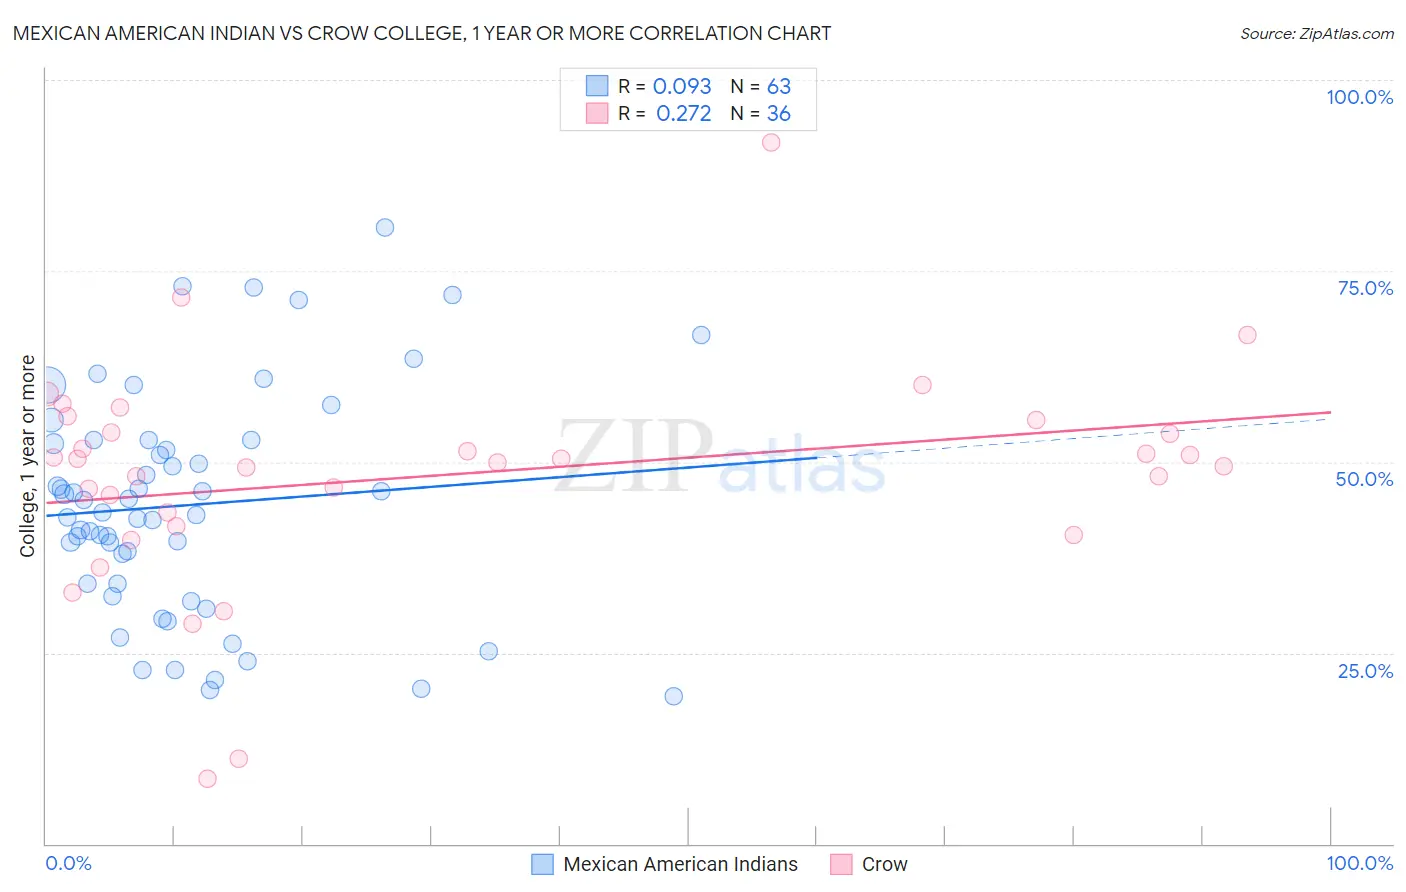
Mexican American Indian vs Crow College, 1 year or more Correlation Chart
The statistical analysis conducted on geographies consisting of 317,621,155 people shows a slight positive correlation between the proportion of Mexican American Indians and percentage of population with at least college, 1 year or more education in the United States with a correlation coefficient (R) of 0.093 and weighted average of 51.9%. Similarly, the statistical analysis conducted on geographies consisting of 59,209,980 people shows a weak positive correlation between the proportion of Crow and percentage of population with at least college, 1 year or more education in the United States with a correlation coefficient (R) of 0.272 and weighted average of 54.5%, a difference of 5.0%.
College, 1 year or more Correlation Summary
| Measurement | Mexican American Indian | Crow |
| Minimum | 19.3% | 8.6% |
| Maximum | 80.8% | 91.8% |
| Range | 61.4% | 83.3% |
| Mean | 44.3% | 48.2% |
| Median | 43.4% | 50.2% |
| Interquartile 25% (IQ1) | 34.0% | 42.5% |
| Interquartile 75% (IQ3) | 52.8% | 54.7% |
| Interquartile Range (IQR) | 18.8% | 12.2% |
| Standard Deviation (Sample) | 14.6% | 14.8% |
| Standard Deviation (Population) | 14.5% | 14.6% |
Similar Demographics by College, 1 year or more
Demographics Similar to Mexican American Indians by College, 1 year or more
In terms of college, 1 year or more, the demographic groups most similar to Mexican American Indians are Immigrants from Portugal (51.9%, a difference of 0.10%), Salvadoran (51.8%, a difference of 0.20%), Apache (51.8%, a difference of 0.22%), Seminole (52.1%, a difference of 0.33%), and Central American (52.1%, a difference of 0.43%).
| Demographics | Rating | Rank | College, 1 year or more |
| Immigrants | Nicaragua | 0.0 /100 | #299 | Tragic 52.4% |
| Choctaw | 0.0 /100 | #300 | Tragic 52.3% |
| Haitians | 0.0 /100 | #301 | Tragic 52.3% |
| Puerto Ricans | 0.0 /100 | #302 | Tragic 52.2% |
| Creek | 0.0 /100 | #303 | Tragic 52.2% |
| Central Americans | 0.0 /100 | #304 | Tragic 52.1% |
| Seminole | 0.0 /100 | #305 | Tragic 52.1% |
| Mexican American Indians | 0.0 /100 | #306 | Tragic 51.9% |
| Immigrants | Portugal | 0.0 /100 | #307 | Tragic 51.9% |
| Salvadorans | 0.0 /100 | #308 | Tragic 51.8% |
| Apache | 0.0 /100 | #309 | Tragic 51.8% |
| Hondurans | 0.0 /100 | #310 | Tragic 51.6% |
| Immigrants | Haiti | 0.0 /100 | #311 | Tragic 51.5% |
| Pueblo | 0.0 /100 | #312 | Tragic 51.5% |
| Immigrants | Caribbean | 0.0 /100 | #313 | Tragic 51.4% |
Demographics Similar to Crow by College, 1 year or more
In terms of college, 1 year or more, the demographic groups most similar to Crow are Bahamian (54.5%, a difference of 0.020%), Bangladeshi (54.5%, a difference of 0.030%), British West Indian (54.5%, a difference of 0.070%), Comanche (54.4%, a difference of 0.070%), and Immigrants from Grenada (54.4%, a difference of 0.11%).
| Demographics | Rating | Rank | College, 1 year or more |
| U.S. Virgin Islanders | 0.3 /100 | #263 | Tragic 54.8% |
| Immigrants | Micronesia | 0.3 /100 | #264 | Tragic 54.8% |
| Immigrants | Laos | 0.2 /100 | #265 | Tragic 54.7% |
| Potawatomi | 0.2 /100 | #266 | Tragic 54.6% |
| Blackfeet | 0.2 /100 | #267 | Tragic 54.6% |
| British West Indians | 0.2 /100 | #268 | Tragic 54.5% |
| Bangladeshis | 0.2 /100 | #269 | Tragic 54.5% |
| Crow | 0.2 /100 | #270 | Tragic 54.5% |
| Bahamians | 0.2 /100 | #271 | Tragic 54.5% |
| Comanche | 0.2 /100 | #272 | Tragic 54.4% |
| Immigrants | Grenada | 0.2 /100 | #273 | Tragic 54.4% |
| Belizeans | 0.2 /100 | #274 | Tragic 54.4% |
| Americans | 0.2 /100 | #275 | Tragic 54.4% |
| Shoshone | 0.2 /100 | #276 | Tragic 54.3% |
| Ecuadorians | 0.2 /100 | #277 | Tragic 54.3% |