Kenyan vs Venezuelan College, 1 year or more
COMPARE
Kenyan
Venezuelan
College, 1 year or more
College, 1 year or more Comparison
Kenyans
Venezuelans
60.5%
COLLEGE, 1 YEAR OR MORE
79.0/ 100
METRIC RATING
148th/ 347
METRIC RANK
61.3%
COLLEGE, 1 YEAR OR MORE
92.1/ 100
METRIC RATING
124th/ 347
METRIC RANK
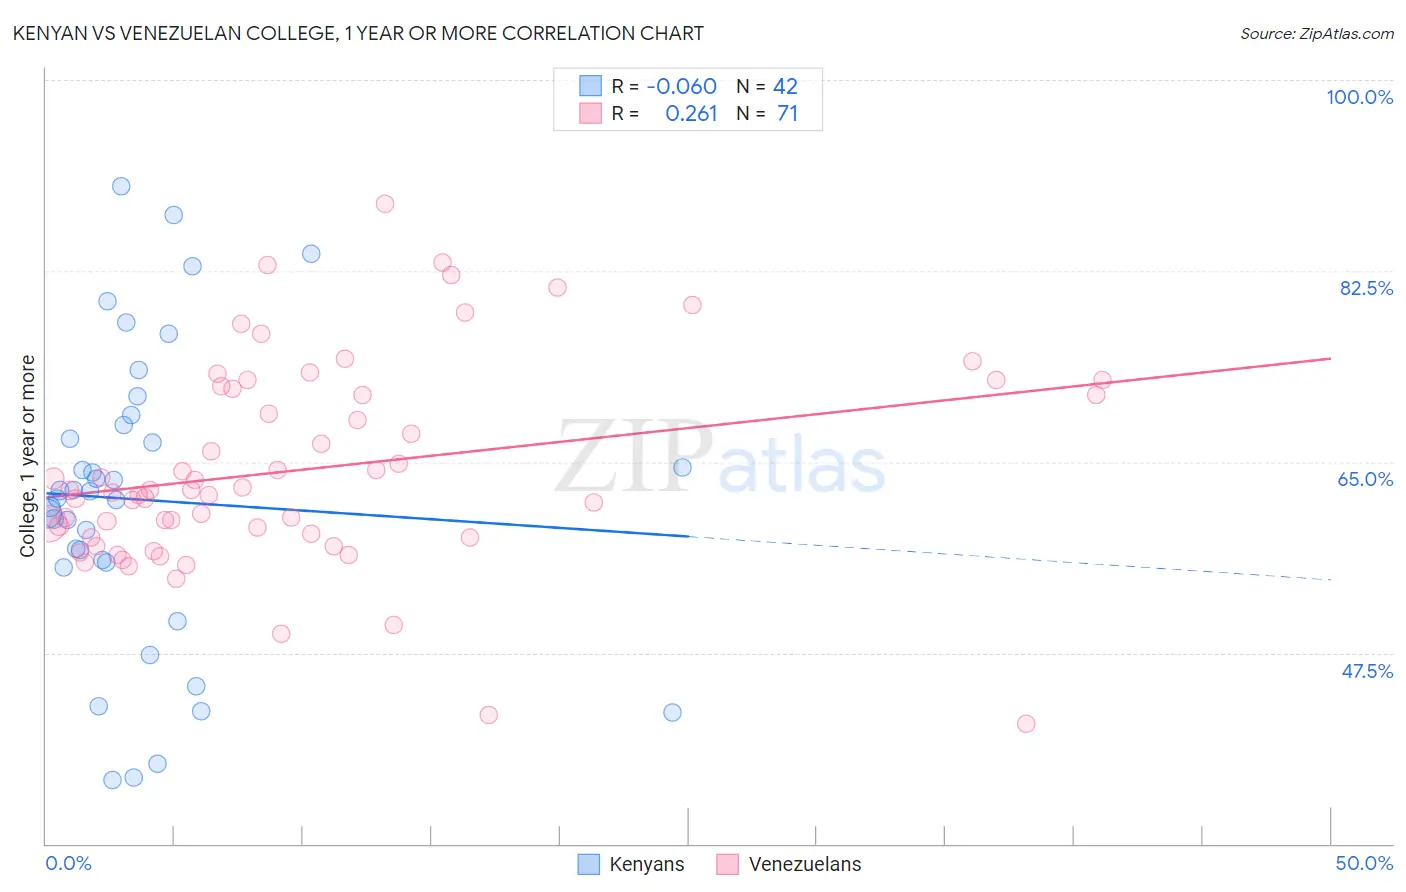
Kenyan vs Venezuelan College, 1 year or more Correlation Chart
The statistical analysis conducted on geographies consisting of 168,244,481 people shows a slight negative correlation between the proportion of Kenyans and percentage of population with at least college, 1 year or more education in the United States with a correlation coefficient (R) of -0.060 and weighted average of 60.5%. Similarly, the statistical analysis conducted on geographies consisting of 306,322,543 people shows a weak positive correlation between the proportion of Venezuelans and percentage of population with at least college, 1 year or more education in the United States with a correlation coefficient (R) of 0.261 and weighted average of 61.3%, a difference of 1.5%.
College, 1 year or more Correlation Summary
| Measurement | Kenyan | Venezuelan |
| Minimum | 35.8% | 41.0% |
| Maximum | 90.2% | 88.6% |
| Range | 54.4% | 47.7% |
| Mean | 61.5% | 64.3% |
| Median | 62.0% | 62.4% |
| Interquartile 25% (IQ1) | 55.8% | 58.1% |
| Interquartile 75% (IQ3) | 68.3% | 71.7% |
| Interquartile Range (IQR) | 12.6% | 13.6% |
| Standard Deviation (Sample) | 13.5% | 9.4% |
| Standard Deviation (Population) | 13.4% | 9.3% |
Similar Demographics by College, 1 year or more
Demographics Similar to Kenyans by College, 1 year or more
In terms of college, 1 year or more, the demographic groups most similar to Kenyans are Brazilian (60.5%, a difference of 0.0%), Immigrants from Kenya (60.5%, a difference of 0.010%), Immigrants from Sudan (60.4%, a difference of 0.090%), Albanian (60.4%, a difference of 0.090%), and Scottish (60.5%, a difference of 0.10%).
| Demographics | Rating | Rank | College, 1 year or more |
| Immigrants | Afghanistan | 83.1 /100 | #141 | Excellent 60.7% |
| Poles | 82.8 /100 | #142 | Excellent 60.7% |
| Canadians | 82.7 /100 | #143 | Excellent 60.6% |
| Czechs | 81.9 /100 | #144 | Excellent 60.6% |
| Slavs | 81.1 /100 | #145 | Excellent 60.6% |
| Scottish | 80.2 /100 | #146 | Excellent 60.5% |
| Immigrants | Kenya | 79.1 /100 | #147 | Good 60.5% |
| Kenyans | 79.0 /100 | #148 | Good 60.5% |
| Brazilians | 79.0 /100 | #149 | Good 60.5% |
| Immigrants | Sudan | 77.8 /100 | #150 | Good 60.4% |
| Albanians | 77.8 /100 | #151 | Good 60.4% |
| Immigrants | Germany | 76.1 /100 | #152 | Good 60.3% |
| Sierra Leoneans | 74.1 /100 | #153 | Good 60.2% |
| Sudanese | 73.0 /100 | #154 | Good 60.2% |
| Moroccans | 72.9 /100 | #155 | Good 60.2% |
Demographics Similar to Venezuelans by College, 1 year or more
In terms of college, 1 year or more, the demographic groups most similar to Venezuelans are Serbian (61.4%, a difference of 0.030%), Immigrants from Chile (61.4%, a difference of 0.040%), Immigrants from Syria (61.3%, a difference of 0.080%), Immigrants from Jordan (61.4%, a difference of 0.12%), and Alsatian (61.3%, a difference of 0.13%).
| Demographics | Rating | Rank | College, 1 year or more |
| Arabs | 93.9 /100 | #117 | Exceptional 61.6% |
| Immigrants | Brazil | 93.9 /100 | #118 | Exceptional 61.6% |
| Assyrians/Chaldeans/Syriacs | 93.3 /100 | #119 | Exceptional 61.5% |
| Pakistanis | 93.2 /100 | #120 | Exceptional 61.5% |
| Immigrants | Jordan | 92.7 /100 | #121 | Exceptional 61.4% |
| Immigrants | Chile | 92.3 /100 | #122 | Exceptional 61.4% |
| Serbians | 92.2 /100 | #123 | Exceptional 61.4% |
| Venezuelans | 92.1 /100 | #124 | Exceptional 61.3% |
| Immigrants | Syria | 91.6 /100 | #125 | Exceptional 61.3% |
| Alsatians | 91.3 /100 | #126 | Exceptional 61.3% |
| Immigrants | Eastern Africa | 91.1 /100 | #127 | Exceptional 61.2% |
| Immigrants | Italy | 91.1 /100 | #128 | Exceptional 61.2% |
| Ugandans | 90.7 /100 | #129 | Exceptional 61.2% |
| Italians | 89.5 /100 | #130 | Excellent 61.1% |
| Immigrants | Morocco | 89.5 /100 | #131 | Excellent 61.1% |