Kenyan vs Immigrants from Sri Lanka College, 1 year or more
COMPARE
Kenyan
Immigrants from Sri Lanka
College, 1 year or more
College, 1 year or more Comparison
Kenyans
Immigrants from Sri Lanka
60.5%
COLLEGE, 1 YEAR OR MORE
79.0/ 100
METRIC RATING
148th/ 347
METRIC RANK
65.4%
COLLEGE, 1 YEAR OR MORE
99.9/ 100
METRIC RATING
33rd/ 347
METRIC RANK
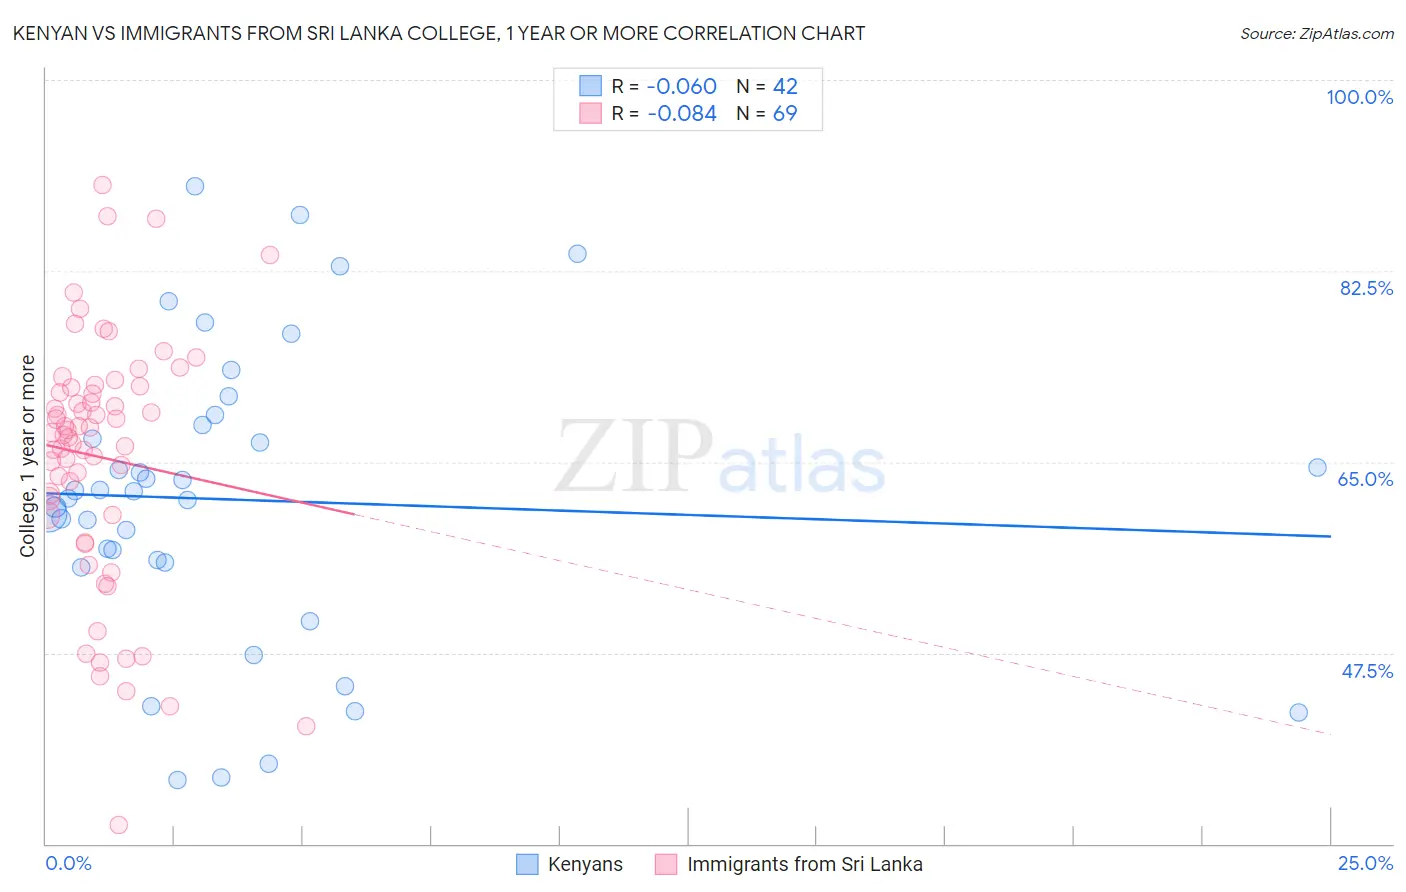
Kenyan vs Immigrants from Sri Lanka College, 1 year or more Correlation Chart
The statistical analysis conducted on geographies consisting of 168,244,481 people shows a slight negative correlation between the proportion of Kenyans and percentage of population with at least college, 1 year or more education in the United States with a correlation coefficient (R) of -0.060 and weighted average of 60.5%. Similarly, the statistical analysis conducted on geographies consisting of 149,700,552 people shows a slight negative correlation between the proportion of Immigrants from Sri Lanka and percentage of population with at least college, 1 year or more education in the United States with a correlation coefficient (R) of -0.084 and weighted average of 65.4%, a difference of 8.2%.
College, 1 year or more Correlation Summary
| Measurement | Kenyan | Immigrants from Sri Lanka |
| Minimum | 35.8% | 31.7% |
| Maximum | 90.2% | 90.4% |
| Range | 54.4% | 58.7% |
| Mean | 61.5% | 65.4% |
| Median | 62.0% | 67.7% |
| Interquartile 25% (IQ1) | 55.8% | 60.1% |
| Interquartile 75% (IQ3) | 68.3% | 71.9% |
| Interquartile Range (IQR) | 12.6% | 11.8% |
| Standard Deviation (Sample) | 13.5% | 11.5% |
| Standard Deviation (Population) | 13.4% | 11.4% |
Similar Demographics by College, 1 year or more
Demographics Similar to Kenyans by College, 1 year or more
In terms of college, 1 year or more, the demographic groups most similar to Kenyans are Brazilian (60.5%, a difference of 0.0%), Immigrants from Kenya (60.5%, a difference of 0.010%), Immigrants from Sudan (60.4%, a difference of 0.090%), Albanian (60.4%, a difference of 0.090%), and Scottish (60.5%, a difference of 0.10%).
| Demographics | Rating | Rank | College, 1 year or more |
| Immigrants | Afghanistan | 83.1 /100 | #141 | Excellent 60.7% |
| Poles | 82.8 /100 | #142 | Excellent 60.7% |
| Canadians | 82.7 /100 | #143 | Excellent 60.6% |
| Czechs | 81.9 /100 | #144 | Excellent 60.6% |
| Slavs | 81.1 /100 | #145 | Excellent 60.6% |
| Scottish | 80.2 /100 | #146 | Excellent 60.5% |
| Immigrants | Kenya | 79.1 /100 | #147 | Good 60.5% |
| Kenyans | 79.0 /100 | #148 | Good 60.5% |
| Brazilians | 79.0 /100 | #149 | Good 60.5% |
| Immigrants | Sudan | 77.8 /100 | #150 | Good 60.4% |
| Albanians | 77.8 /100 | #151 | Good 60.4% |
| Immigrants | Germany | 76.1 /100 | #152 | Good 60.3% |
| Sierra Leoneans | 74.1 /100 | #153 | Good 60.2% |
| Sudanese | 73.0 /100 | #154 | Good 60.2% |
| Moroccans | 72.9 /100 | #155 | Good 60.2% |
Demographics Similar to Immigrants from Sri Lanka by College, 1 year or more
In terms of college, 1 year or more, the demographic groups most similar to Immigrants from Sri Lanka are Israeli (65.3%, a difference of 0.12%), Bulgarian (65.5%, a difference of 0.15%), Turkish (65.5%, a difference of 0.20%), Immigrants from Denmark (65.6%, a difference of 0.28%), and Immigrants from Turkey (65.2%, a difference of 0.32%).
| Demographics | Rating | Rank | College, 1 year or more |
| Latvians | 100.0 /100 | #26 | Exceptional 66.1% |
| Immigrants | Ireland | 100.0 /100 | #27 | Exceptional 65.9% |
| Immigrants | France | 100.0 /100 | #28 | Exceptional 65.8% |
| Immigrants | Northern Europe | 100.0 /100 | #29 | Exceptional 65.6% |
| Immigrants | Denmark | 100.0 /100 | #30 | Exceptional 65.6% |
| Turks | 100.0 /100 | #31 | Exceptional 65.5% |
| Bulgarians | 100.0 /100 | #32 | Exceptional 65.5% |
| Immigrants | Sri Lanka | 99.9 /100 | #33 | Exceptional 65.4% |
| Israelis | 99.9 /100 | #34 | Exceptional 65.3% |
| Immigrants | Turkey | 99.9 /100 | #35 | Exceptional 65.2% |
| Immigrants | South Africa | 99.9 /100 | #36 | Exceptional 65.1% |
| Russians | 99.9 /100 | #37 | Exceptional 65.1% |
| Immigrants | Saudi Arabia | 99.9 /100 | #38 | Exceptional 65.0% |
| Estonians | 99.9 /100 | #39 | Exceptional 65.0% |
| Immigrants | Kuwait | 99.9 /100 | #40 | Exceptional 65.0% |