Kenyan vs Immigrants from Western Asia College, 1 year or more
COMPARE
Kenyan
Immigrants from Western Asia
College, 1 year or more
College, 1 year or more Comparison
Kenyans
Immigrants from Western Asia
60.5%
COLLEGE, 1 YEAR OR MORE
79.0/ 100
METRIC RATING
148th/ 347
METRIC RANK
62.5%
COLLEGE, 1 YEAR OR MORE
97.9/ 100
METRIC RATING
90th/ 347
METRIC RANK
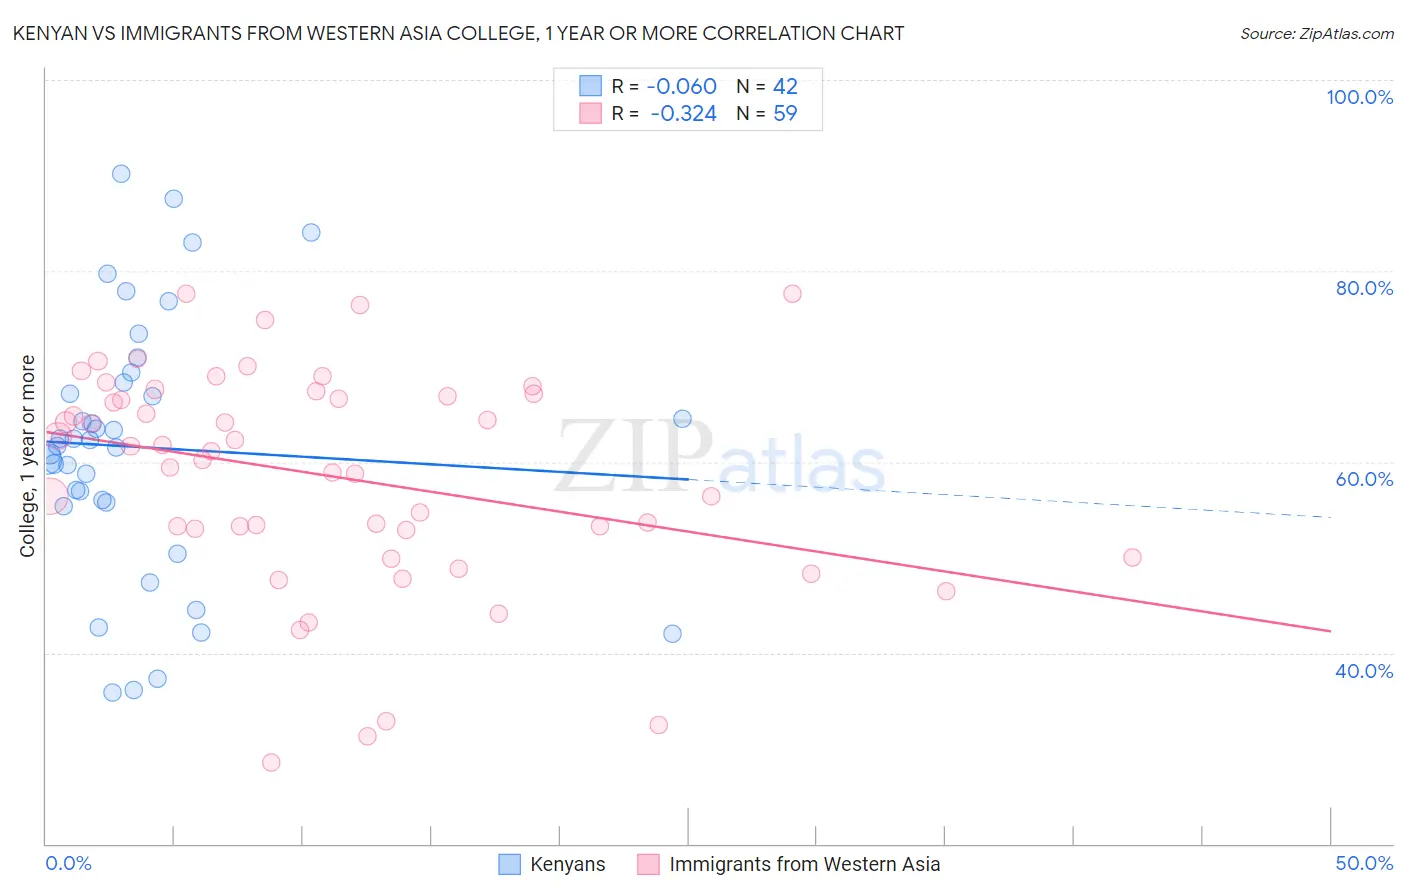
Kenyan vs Immigrants from Western Asia College, 1 year or more Correlation Chart
The statistical analysis conducted on geographies consisting of 168,244,481 people shows a slight negative correlation between the proportion of Kenyans and percentage of population with at least college, 1 year or more education in the United States with a correlation coefficient (R) of -0.060 and weighted average of 60.5%. Similarly, the statistical analysis conducted on geographies consisting of 404,433,351 people shows a mild negative correlation between the proportion of Immigrants from Western Asia and percentage of population with at least college, 1 year or more education in the United States with a correlation coefficient (R) of -0.324 and weighted average of 62.5%, a difference of 3.3%.
College, 1 year or more Correlation Summary
| Measurement | Kenyan | Immigrants from Western Asia |
| Minimum | 35.8% | 28.5% |
| Maximum | 90.2% | 77.6% |
| Range | 54.4% | 49.1% |
| Mean | 61.5% | 58.5% |
| Median | 62.0% | 61.2% |
| Interquartile 25% (IQ1) | 55.8% | 52.9% |
| Interquartile 75% (IQ3) | 68.3% | 67.1% |
| Interquartile Range (IQR) | 12.6% | 14.3% |
| Standard Deviation (Sample) | 13.5% | 11.5% |
| Standard Deviation (Population) | 13.4% | 11.4% |
Similar Demographics by College, 1 year or more
Demographics Similar to Kenyans by College, 1 year or more
In terms of college, 1 year or more, the demographic groups most similar to Kenyans are Brazilian (60.5%, a difference of 0.0%), Immigrants from Kenya (60.5%, a difference of 0.010%), Immigrants from Sudan (60.4%, a difference of 0.090%), Albanian (60.4%, a difference of 0.090%), and Scottish (60.5%, a difference of 0.10%).
| Demographics | Rating | Rank | College, 1 year or more |
| Immigrants | Afghanistan | 83.1 /100 | #141 | Excellent 60.7% |
| Poles | 82.8 /100 | #142 | Excellent 60.7% |
| Canadians | 82.7 /100 | #143 | Excellent 60.6% |
| Czechs | 81.9 /100 | #144 | Excellent 60.6% |
| Slavs | 81.1 /100 | #145 | Excellent 60.6% |
| Scottish | 80.2 /100 | #146 | Excellent 60.5% |
| Immigrants | Kenya | 79.1 /100 | #147 | Good 60.5% |
| Kenyans | 79.0 /100 | #148 | Good 60.5% |
| Brazilians | 79.0 /100 | #149 | Good 60.5% |
| Immigrants | Sudan | 77.8 /100 | #150 | Good 60.4% |
| Albanians | 77.8 /100 | #151 | Good 60.4% |
| Immigrants | Germany | 76.1 /100 | #152 | Good 60.3% |
| Sierra Leoneans | 74.1 /100 | #153 | Good 60.2% |
| Sudanese | 73.0 /100 | #154 | Good 60.2% |
| Moroccans | 72.9 /100 | #155 | Good 60.2% |
Demographics Similar to Immigrants from Western Asia by College, 1 year or more
In terms of college, 1 year or more, the demographic groups most similar to Immigrants from Western Asia are Immigrants from Eastern Europe (62.4%, a difference of 0.10%), Immigrants from Egypt (62.4%, a difference of 0.11%), Romanian (62.4%, a difference of 0.14%), Immigrants from Ethiopia (62.6%, a difference of 0.17%), and Immigrants from Croatia (62.3%, a difference of 0.20%).
| Demographics | Rating | Rank | College, 1 year or more |
| Immigrants | Argentina | 98.6 /100 | #83 | Exceptional 62.8% |
| Immigrants | England | 98.6 /100 | #84 | Exceptional 62.8% |
| Immigrants | Pakistan | 98.6 /100 | #85 | Exceptional 62.8% |
| Immigrants | Western Europe | 98.6 /100 | #86 | Exceptional 62.7% |
| Immigrants | Hungary | 98.6 /100 | #87 | Exceptional 62.7% |
| Greeks | 98.3 /100 | #88 | Exceptional 62.6% |
| Immigrants | Ethiopia | 98.2 /100 | #89 | Exceptional 62.6% |
| Immigrants | Western Asia | 97.9 /100 | #90 | Exceptional 62.5% |
| Immigrants | Eastern Europe | 97.8 /100 | #91 | Exceptional 62.4% |
| Immigrants | Egypt | 97.8 /100 | #92 | Exceptional 62.4% |
| Romanians | 97.7 /100 | #93 | Exceptional 62.4% |
| Immigrants | Croatia | 97.6 /100 | #94 | Exceptional 62.3% |
| British | 97.4 /100 | #95 | Exceptional 62.3% |
| Chinese | 97.2 /100 | #96 | Exceptional 62.2% |
| Jordanians | 97.2 /100 | #97 | Exceptional 62.2% |