Immigrants from Uzbekistan vs Turkish GED/Equivalency
COMPARE
Immigrants from Uzbekistan
Turkish
GED/Equivalency
GED/Equivalency Comparison
Immigrants from Uzbekistan
Turks
84.6%
GED/EQUIVALENCY
7.1/ 100
METRIC RATING
223rd/ 347
METRIC RANK
88.5%
GED/EQUIVALENCY
99.8/ 100
METRIC RATING
30th/ 347
METRIC RANK
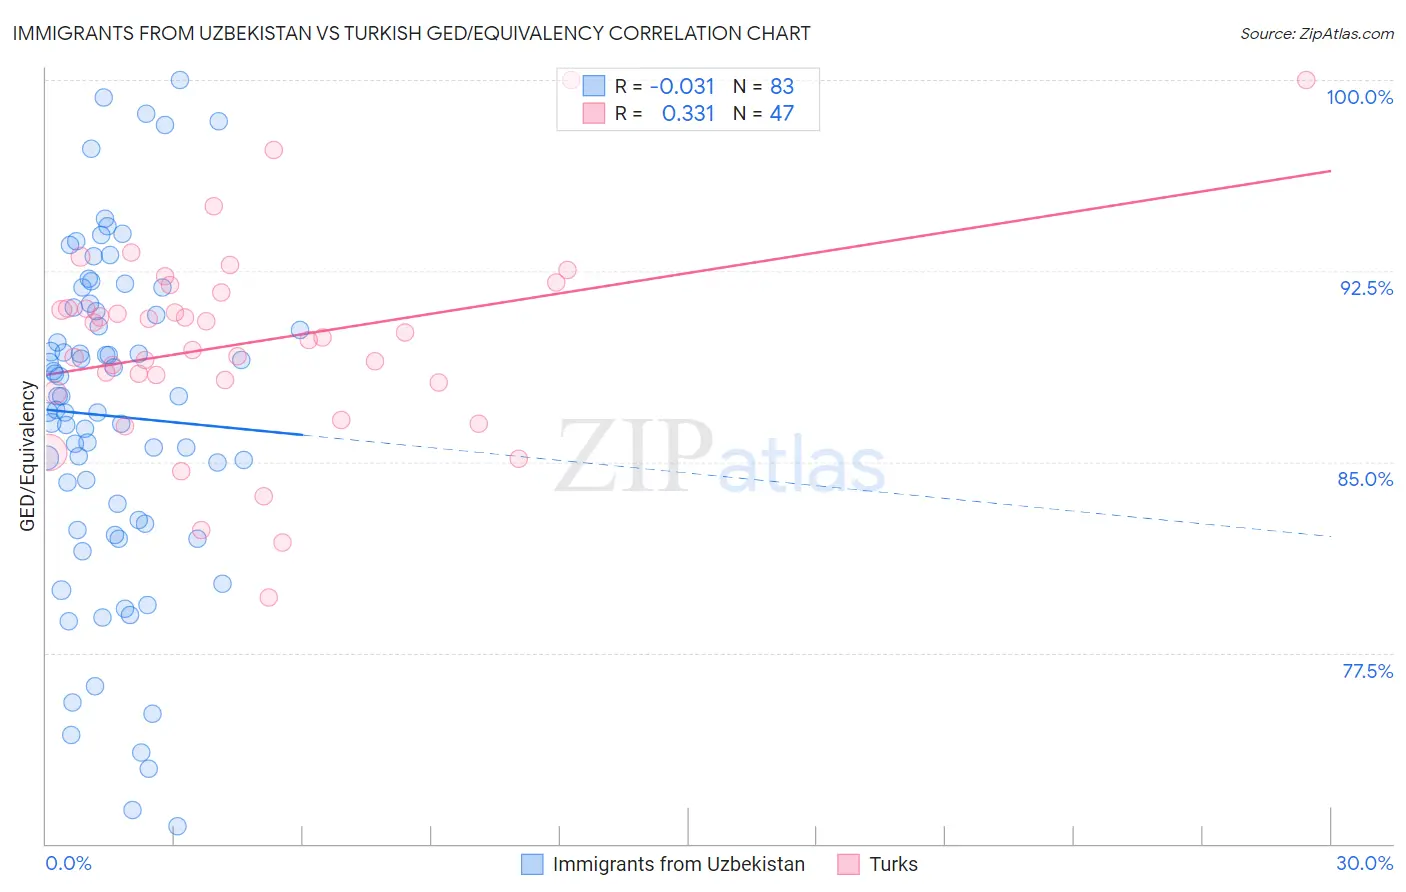
Immigrants from Uzbekistan vs Turkish GED/Equivalency Correlation Chart
The statistical analysis conducted on geographies consisting of 118,765,305 people shows no correlation between the proportion of Immigrants from Uzbekistan and percentage of population with at least ged/equivalency education in the United States with a correlation coefficient (R) of -0.031 and weighted average of 84.6%. Similarly, the statistical analysis conducted on geographies consisting of 271,864,133 people shows a mild positive correlation between the proportion of Turks and percentage of population with at least ged/equivalency education in the United States with a correlation coefficient (R) of 0.331 and weighted average of 88.5%, a difference of 4.5%.
GED/Equivalency Correlation Summary
| Measurement | Immigrants from Uzbekistan | Turkish |
| Minimum | 70.7% | 79.7% |
| Maximum | 100.0% | 100.0% |
| Range | 29.3% | 20.3% |
| Mean | 86.8% | 89.7% |
| Median | 87.6% | 89.9% |
| Interquartile 25% (IQ1) | 82.6% | 88.1% |
| Interquartile 75% (IQ3) | 91.1% | 91.7% |
| Interquartile Range (IQR) | 8.5% | 3.5% |
| Standard Deviation (Sample) | 6.6% | 4.0% |
| Standard Deviation (Population) | 6.5% | 4.0% |
Similar Demographics by GED/Equivalency
Demographics Similar to Immigrants from Uzbekistan by GED/Equivalency
In terms of ged/equivalency, the demographic groups most similar to Immigrants from Uzbekistan are Iroquois (84.6%, a difference of 0.030%), Taiwanese (84.7%, a difference of 0.070%), French American Indian (84.6%, a difference of 0.070%), Potawatomi (84.7%, a difference of 0.080%), and American (84.7%, a difference of 0.080%).
| Demographics | Rating | Rank | GED/Equivalency |
| Immigrants | Micronesia | 8.7 /100 | #216 | Tragic 84.7% |
| Nigerians | 8.6 /100 | #217 | Tragic 84.7% |
| Alaska Natives | 8.6 /100 | #218 | Tragic 84.7% |
| Potawatomi | 8.2 /100 | #219 | Tragic 84.7% |
| Americans | 8.2 /100 | #220 | Tragic 84.7% |
| Taiwanese | 8.1 /100 | #221 | Tragic 84.7% |
| Iroquois | 7.5 /100 | #222 | Tragic 84.6% |
| Immigrants | Uzbekistan | 7.1 /100 | #223 | Tragic 84.6% |
| French American Indians | 6.3 /100 | #224 | Tragic 84.6% |
| Immigrants | Thailand | 5.8 /100 | #225 | Tragic 84.5% |
| Immigrants | Zaire | 5.5 /100 | #226 | Tragic 84.5% |
| Immigrants | Costa Rica | 5.4 /100 | #227 | Tragic 84.5% |
| Immigrants | Liberia | 4.9 /100 | #228 | Tragic 84.4% |
| Immigrants | Uruguay | 4.6 /100 | #229 | Tragic 84.4% |
| Immigrants | Colombia | 4.5 /100 | #230 | Tragic 84.4% |
Demographics Similar to Turks by GED/Equivalency
In terms of ged/equivalency, the demographic groups most similar to Turks are Polish (88.5%, a difference of 0.020%), Bhutanese (88.4%, a difference of 0.030%), Immigrants from Northern Europe (88.5%, a difference of 0.050%), Danish (88.4%, a difference of 0.050%), and Immigrants from Lithuania (88.6%, a difference of 0.090%).
| Demographics | Rating | Rank | GED/Equivalency |
| Russians | 99.8 /100 | #23 | Exceptional 88.6% |
| Slovaks | 99.8 /100 | #24 | Exceptional 88.6% |
| Estonians | 99.8 /100 | #25 | Exceptional 88.6% |
| Immigrants | Australia | 99.8 /100 | #26 | Exceptional 88.6% |
| Immigrants | Lithuania | 99.8 /100 | #27 | Exceptional 88.6% |
| Immigrants | Northern Europe | 99.8 /100 | #28 | Exceptional 88.5% |
| Poles | 99.8 /100 | #29 | Exceptional 88.5% |
| Turks | 99.8 /100 | #30 | Exceptional 88.5% |
| Bhutanese | 99.8 /100 | #31 | Exceptional 88.4% |
| Danes | 99.8 /100 | #32 | Exceptional 88.4% |
| Immigrants | Sweden | 99.7 /100 | #33 | Exceptional 88.4% |
| Immigrants | Japan | 99.7 /100 | #34 | Exceptional 88.4% |
| Immigrants | South Central Asia | 99.7 /100 | #35 | Exceptional 88.4% |
| Immigrants | Belgium | 99.7 /100 | #36 | Exceptional 88.3% |
| Immigrants | Austria | 99.7 /100 | #37 | Exceptional 88.3% |