Immigrants from Uzbekistan vs Norwegian GED/Equivalency
COMPARE
Immigrants from Uzbekistan
Norwegian
GED/Equivalency
GED/Equivalency Comparison
Immigrants from Uzbekistan
Norwegians
84.6%
GED/EQUIVALENCY
7.1/ 100
METRIC RATING
223rd/ 347
METRIC RANK
89.0%
GED/EQUIVALENCY
99.9/ 100
METRIC RATING
10th/ 347
METRIC RANK
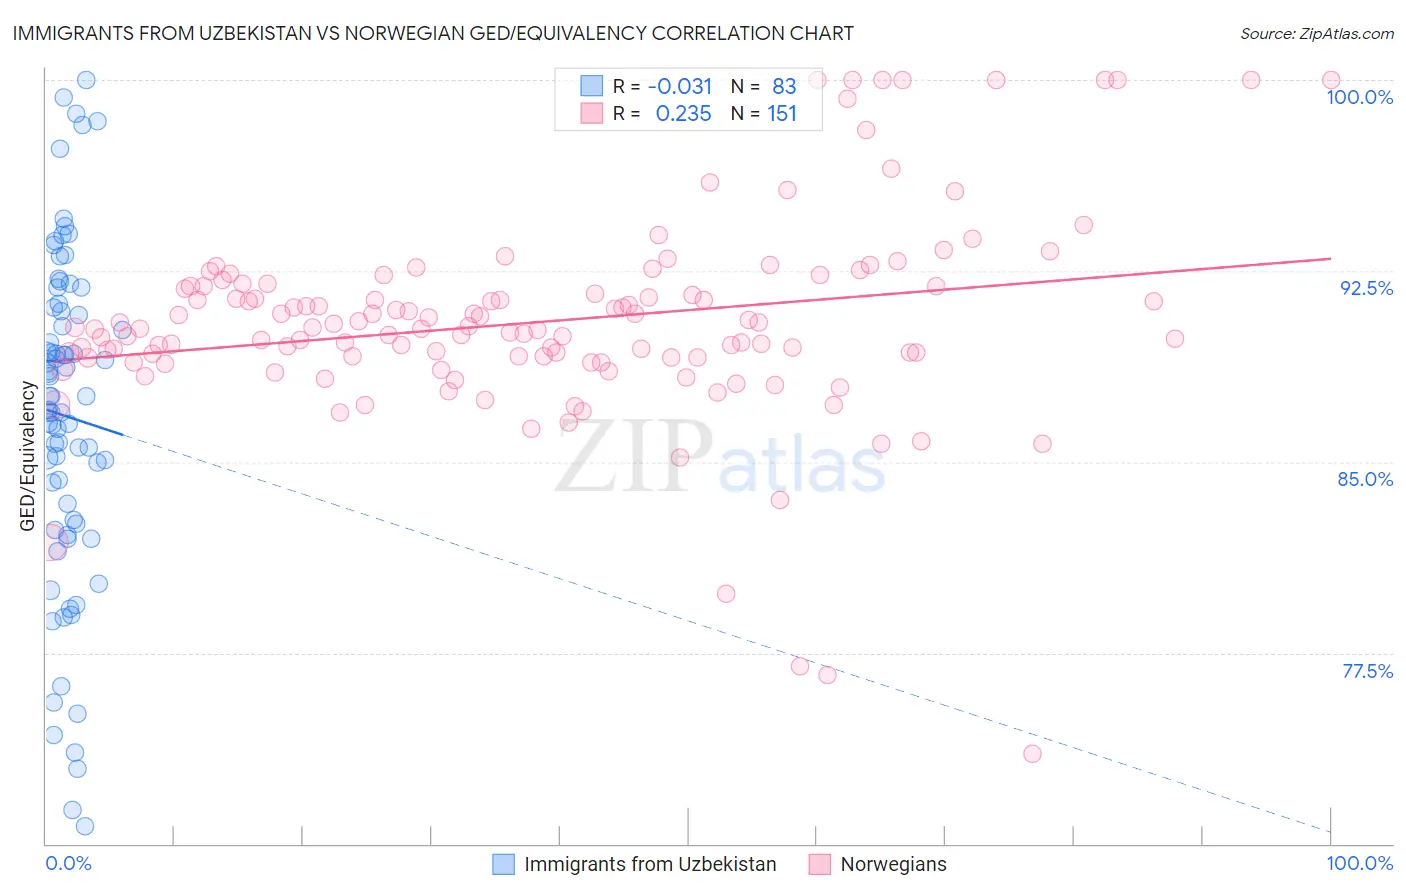
Immigrants from Uzbekistan vs Norwegian GED/Equivalency Correlation Chart
The statistical analysis conducted on geographies consisting of 118,765,305 people shows no correlation between the proportion of Immigrants from Uzbekistan and percentage of population with at least ged/equivalency education in the United States with a correlation coefficient (R) of -0.031 and weighted average of 84.6%. Similarly, the statistical analysis conducted on geographies consisting of 533,395,248 people shows a weak positive correlation between the proportion of Norwegians and percentage of population with at least ged/equivalency education in the United States with a correlation coefficient (R) of 0.235 and weighted average of 89.0%, a difference of 5.2%.
GED/Equivalency Correlation Summary
| Measurement | Immigrants from Uzbekistan | Norwegian |
| Minimum | 70.7% | 73.5% |
| Maximum | 100.0% | 100.0% |
| Range | 29.3% | 26.5% |
| Mean | 86.8% | 90.5% |
| Median | 87.6% | 90.2% |
| Interquartile 25% (IQ1) | 82.6% | 89.1% |
| Interquartile 75% (IQ3) | 91.1% | 91.9% |
| Interquartile Range (IQR) | 8.5% | 2.8% |
| Standard Deviation (Sample) | 6.6% | 4.0% |
| Standard Deviation (Population) | 6.5% | 4.0% |
Similar Demographics by GED/Equivalency
Demographics Similar to Immigrants from Uzbekistan by GED/Equivalency
In terms of ged/equivalency, the demographic groups most similar to Immigrants from Uzbekistan are Iroquois (84.6%, a difference of 0.030%), Taiwanese (84.7%, a difference of 0.070%), French American Indian (84.6%, a difference of 0.070%), Potawatomi (84.7%, a difference of 0.080%), and American (84.7%, a difference of 0.080%).
| Demographics | Rating | Rank | GED/Equivalency |
| Immigrants | Micronesia | 8.7 /100 | #216 | Tragic 84.7% |
| Nigerians | 8.6 /100 | #217 | Tragic 84.7% |
| Alaska Natives | 8.6 /100 | #218 | Tragic 84.7% |
| Potawatomi | 8.2 /100 | #219 | Tragic 84.7% |
| Americans | 8.2 /100 | #220 | Tragic 84.7% |
| Taiwanese | 8.1 /100 | #221 | Tragic 84.7% |
| Iroquois | 7.5 /100 | #222 | Tragic 84.6% |
| Immigrants | Uzbekistan | 7.1 /100 | #223 | Tragic 84.6% |
| French American Indians | 6.3 /100 | #224 | Tragic 84.6% |
| Immigrants | Thailand | 5.8 /100 | #225 | Tragic 84.5% |
| Immigrants | Zaire | 5.5 /100 | #226 | Tragic 84.5% |
| Immigrants | Costa Rica | 5.4 /100 | #227 | Tragic 84.5% |
| Immigrants | Liberia | 4.9 /100 | #228 | Tragic 84.4% |
| Immigrants | Uruguay | 4.6 /100 | #229 | Tragic 84.4% |
| Immigrants | Colombia | 4.5 /100 | #230 | Tragic 84.4% |
Demographics Similar to Norwegians by GED/Equivalency
In terms of ged/equivalency, the demographic groups most similar to Norwegians are Chinese (89.0%, a difference of 0.040%), Bulgarian (89.0%, a difference of 0.040%), Carpatho Rusyn (89.1%, a difference of 0.070%), Lithuanian (88.9%, a difference of 0.080%), and Immigrants from Iran (88.9%, a difference of 0.080%).
| Demographics | Rating | Rank | GED/Equivalency |
| Immigrants | Singapore | 100.0 /100 | #3 | Exceptional 89.3% |
| Iranians | 100.0 /100 | #4 | Exceptional 89.2% |
| Latvians | 100.0 /100 | #5 | Exceptional 89.2% |
| Thais | 100.0 /100 | #6 | Exceptional 89.1% |
| Eastern Europeans | 99.9 /100 | #7 | Exceptional 89.1% |
| Carpatho Rusyns | 99.9 /100 | #8 | Exceptional 89.1% |
| Chinese | 99.9 /100 | #9 | Exceptional 89.0% |
| Norwegians | 99.9 /100 | #10 | Exceptional 89.0% |
| Bulgarians | 99.9 /100 | #11 | Exceptional 89.0% |
| Lithuanians | 99.9 /100 | #12 | Exceptional 88.9% |
| Immigrants | Iran | 99.9 /100 | #13 | Exceptional 88.9% |
| Cypriots | 99.9 /100 | #14 | Exceptional 88.9% |
| Okinawans | 99.9 /100 | #15 | Exceptional 88.9% |
| Immigrants | Taiwan | 99.9 /100 | #16 | Exceptional 88.8% |
| Croatians | 99.9 /100 | #17 | Exceptional 88.8% |