Immigrants from Cuba vs Turkish GED/Equivalency
COMPARE
Immigrants from Cuba
Turkish
GED/Equivalency
GED/Equivalency Comparison
Immigrants from Cuba
Turks
80.2%
GED/EQUIVALENCY
0.0/ 100
METRIC RATING
320th/ 347
METRIC RANK
88.5%
GED/EQUIVALENCY
99.8/ 100
METRIC RATING
30th/ 347
METRIC RANK
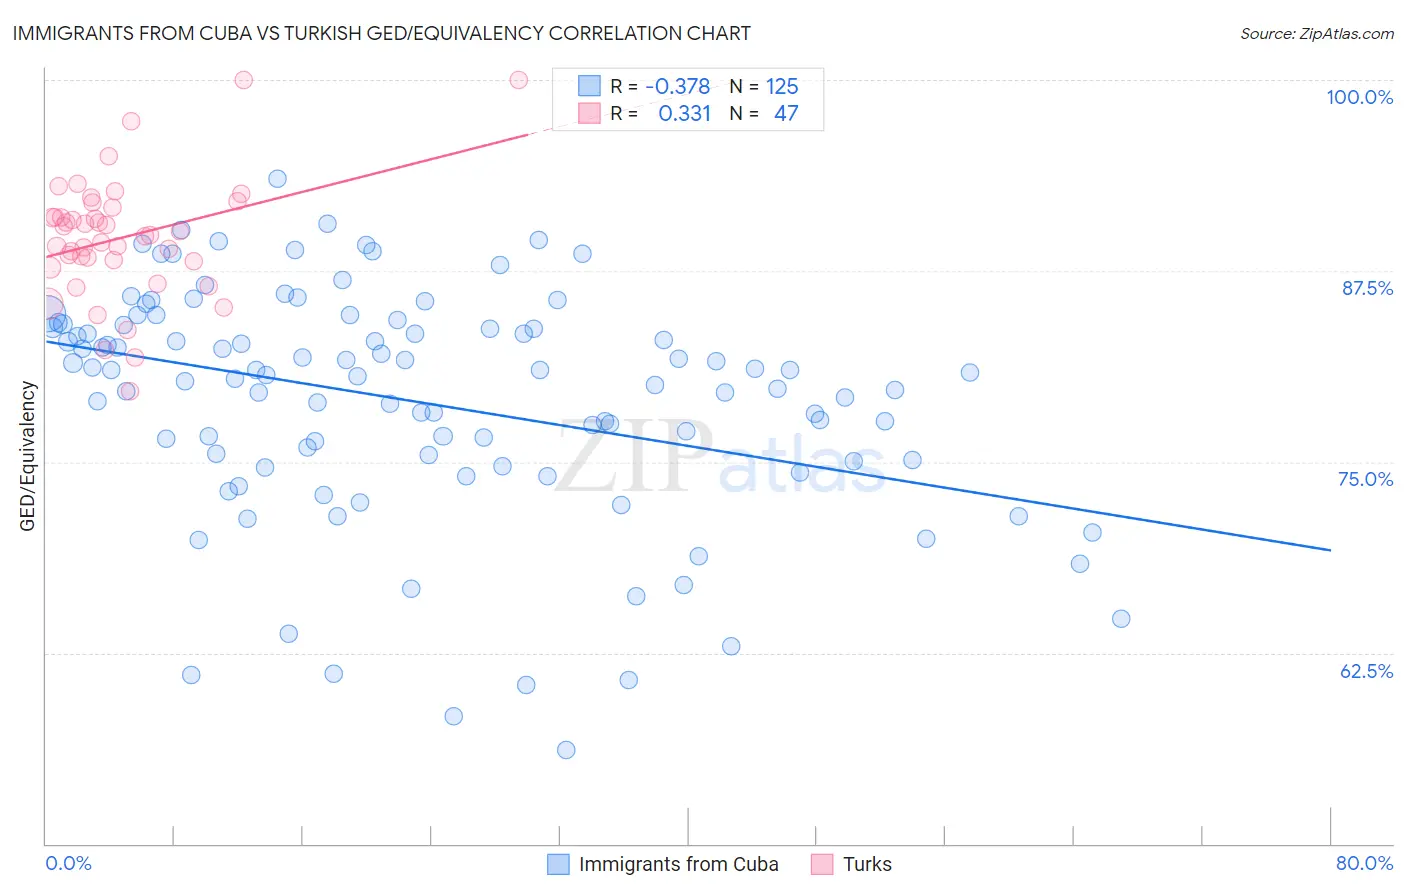
Immigrants from Cuba vs Turkish GED/Equivalency Correlation Chart
The statistical analysis conducted on geographies consisting of 326,030,400 people shows a mild negative correlation between the proportion of Immigrants from Cuba and percentage of population with at least ged/equivalency education in the United States with a correlation coefficient (R) of -0.378 and weighted average of 80.2%. Similarly, the statistical analysis conducted on geographies consisting of 271,864,133 people shows a mild positive correlation between the proportion of Turks and percentage of population with at least ged/equivalency education in the United States with a correlation coefficient (R) of 0.331 and weighted average of 88.5%, a difference of 10.4%.
GED/Equivalency Correlation Summary
| Measurement | Immigrants from Cuba | Turkish |
| Minimum | 56.2% | 79.7% |
| Maximum | 93.5% | 100.0% |
| Range | 37.3% | 20.3% |
| Mean | 79.0% | 89.7% |
| Median | 80.7% | 89.9% |
| Interquartile 25% (IQ1) | 75.1% | 88.1% |
| Interquartile 75% (IQ3) | 83.9% | 91.7% |
| Interquartile Range (IQR) | 8.8% | 3.5% |
| Standard Deviation (Sample) | 7.5% | 4.0% |
| Standard Deviation (Population) | 7.5% | 4.0% |
Similar Demographics by GED/Equivalency
Demographics Similar to Immigrants from Cuba by GED/Equivalency
In terms of ged/equivalency, the demographic groups most similar to Immigrants from Cuba are Yup'ik (80.0%, a difference of 0.17%), Lumbee (80.0%, a difference of 0.24%), Immigrants from Nicaragua (79.9%, a difference of 0.36%), Yaqui (80.5%, a difference of 0.41%), and Immigrants from Belize (80.5%, a difference of 0.41%).
| Demographics | Rating | Rank | GED/Equivalency |
| Cape Verdeans | 0.0 /100 | #313 | Tragic 80.9% |
| Belizeans | 0.0 /100 | #314 | Tragic 80.9% |
| Apache | 0.0 /100 | #315 | Tragic 80.7% |
| Central American Indians | 0.0 /100 | #316 | Tragic 80.6% |
| Immigrants | Caribbean | 0.0 /100 | #317 | Tragic 80.5% |
| Yaqui | 0.0 /100 | #318 | Tragic 80.5% |
| Immigrants | Belize | 0.0 /100 | #319 | Tragic 80.5% |
| Immigrants | Cuba | 0.0 /100 | #320 | Tragic 80.2% |
| Yup'ik | 0.0 /100 | #321 | Tragic 80.0% |
| Lumbee | 0.0 /100 | #322 | Tragic 80.0% |
| Immigrants | Nicaragua | 0.0 /100 | #323 | Tragic 79.9% |
| Mexican American Indians | 0.0 /100 | #324 | Tragic 79.4% |
| Hondurans | 0.0 /100 | #325 | Tragic 79.3% |
| Yuman | 0.0 /100 | #326 | Tragic 79.2% |
| Central Americans | 0.0 /100 | #327 | Tragic 79.2% |
Demographics Similar to Turks by GED/Equivalency
In terms of ged/equivalency, the demographic groups most similar to Turks are Polish (88.5%, a difference of 0.020%), Bhutanese (88.4%, a difference of 0.030%), Immigrants from Northern Europe (88.5%, a difference of 0.050%), Danish (88.4%, a difference of 0.050%), and Immigrants from Lithuania (88.6%, a difference of 0.090%).
| Demographics | Rating | Rank | GED/Equivalency |
| Russians | 99.8 /100 | #23 | Exceptional 88.6% |
| Slovaks | 99.8 /100 | #24 | Exceptional 88.6% |
| Estonians | 99.8 /100 | #25 | Exceptional 88.6% |
| Immigrants | Australia | 99.8 /100 | #26 | Exceptional 88.6% |
| Immigrants | Lithuania | 99.8 /100 | #27 | Exceptional 88.6% |
| Immigrants | Northern Europe | 99.8 /100 | #28 | Exceptional 88.5% |
| Poles | 99.8 /100 | #29 | Exceptional 88.5% |
| Turks | 99.8 /100 | #30 | Exceptional 88.5% |
| Bhutanese | 99.8 /100 | #31 | Exceptional 88.4% |
| Danes | 99.8 /100 | #32 | Exceptional 88.4% |
| Immigrants | Sweden | 99.7 /100 | #33 | Exceptional 88.4% |
| Immigrants | Japan | 99.7 /100 | #34 | Exceptional 88.4% |
| Immigrants | South Central Asia | 99.7 /100 | #35 | Exceptional 88.4% |
| Immigrants | Belgium | 99.7 /100 | #36 | Exceptional 88.3% |
| Immigrants | Austria | 99.7 /100 | #37 | Exceptional 88.3% |