Immigrants from Uzbekistan vs Immigrants from Canada GED/Equivalency
COMPARE
Immigrants from Uzbekistan
Immigrants from Canada
GED/Equivalency
GED/Equivalency Comparison
Immigrants from Uzbekistan
Immigrants from Canada
84.6%
GED/EQUIVALENCY
7.1/ 100
METRIC RATING
223rd/ 347
METRIC RANK
87.9%
GED/EQUIVALENCY
99.2/ 100
METRIC RATING
64th/ 347
METRIC RANK
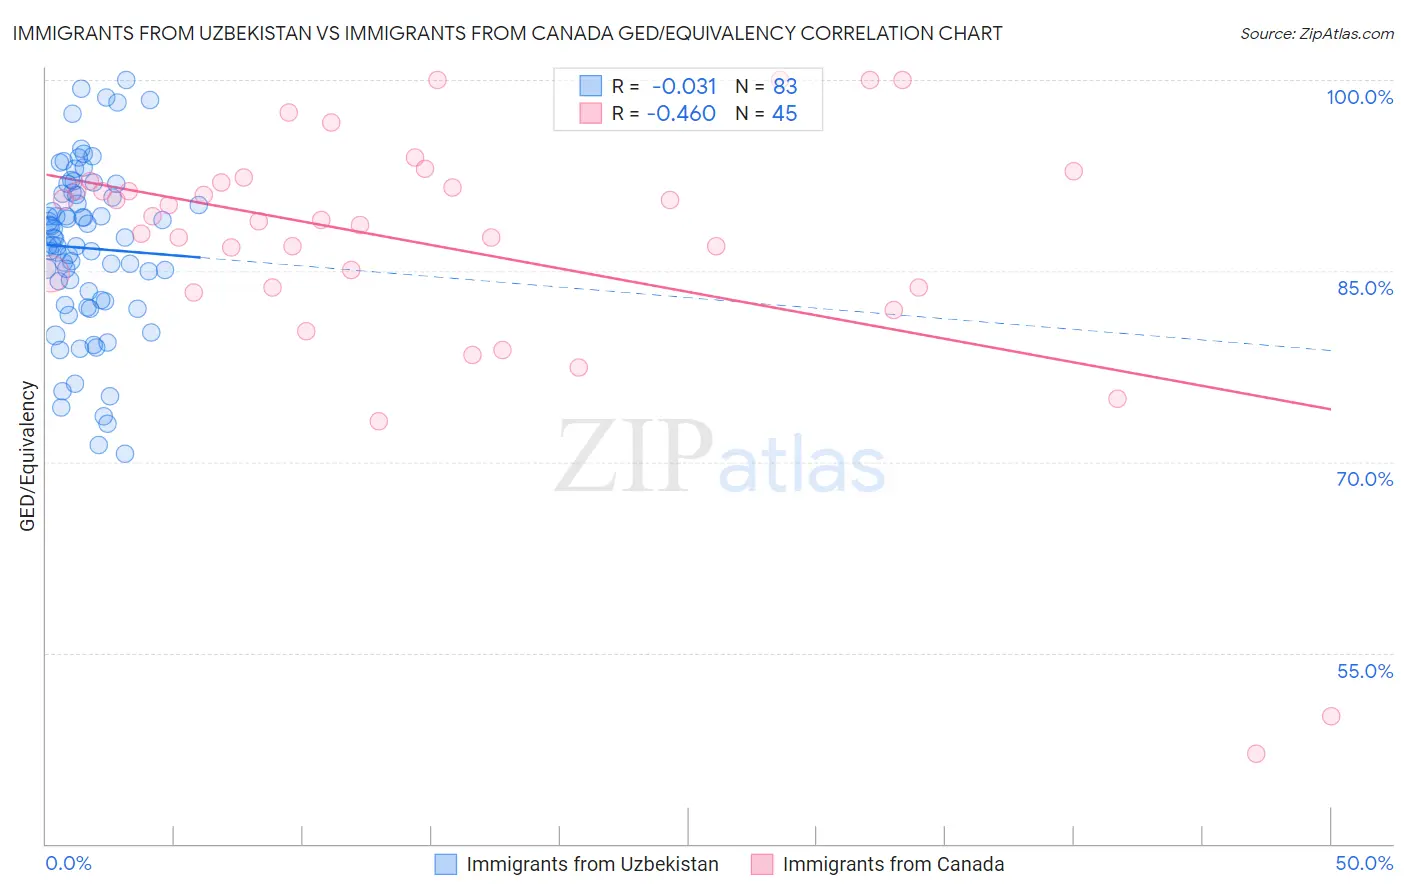
Immigrants from Uzbekistan vs Immigrants from Canada GED/Equivalency Correlation Chart
The statistical analysis conducted on geographies consisting of 118,765,305 people shows no correlation between the proportion of Immigrants from Uzbekistan and percentage of population with at least ged/equivalency education in the United States with a correlation coefficient (R) of -0.031 and weighted average of 84.6%. Similarly, the statistical analysis conducted on geographies consisting of 459,397,064 people shows a moderate negative correlation between the proportion of Immigrants from Canada and percentage of population with at least ged/equivalency education in the United States with a correlation coefficient (R) of -0.460 and weighted average of 87.9%, a difference of 3.8%.
GED/Equivalency Correlation Summary
| Measurement | Immigrants from Uzbekistan | Immigrants from Canada |
| Minimum | 70.7% | 47.1% |
| Maximum | 100.0% | 100.0% |
| Range | 29.3% | 52.9% |
| Mean | 86.8% | 86.9% |
| Median | 87.6% | 89.0% |
| Interquartile 25% (IQ1) | 82.6% | 83.7% |
| Interquartile 75% (IQ3) | 91.1% | 92.0% |
| Interquartile Range (IQR) | 8.5% | 8.3% |
| Standard Deviation (Sample) | 6.6% | 10.5% |
| Standard Deviation (Population) | 6.5% | 10.4% |
Similar Demographics by GED/Equivalency
Demographics Similar to Immigrants from Uzbekistan by GED/Equivalency
In terms of ged/equivalency, the demographic groups most similar to Immigrants from Uzbekistan are Iroquois (84.6%, a difference of 0.030%), Taiwanese (84.7%, a difference of 0.070%), French American Indian (84.6%, a difference of 0.070%), Potawatomi (84.7%, a difference of 0.080%), and American (84.7%, a difference of 0.080%).
| Demographics | Rating | Rank | GED/Equivalency |
| Immigrants | Micronesia | 8.7 /100 | #216 | Tragic 84.7% |
| Nigerians | 8.6 /100 | #217 | Tragic 84.7% |
| Alaska Natives | 8.6 /100 | #218 | Tragic 84.7% |
| Potawatomi | 8.2 /100 | #219 | Tragic 84.7% |
| Americans | 8.2 /100 | #220 | Tragic 84.7% |
| Taiwanese | 8.1 /100 | #221 | Tragic 84.7% |
| Iroquois | 7.5 /100 | #222 | Tragic 84.6% |
| Immigrants | Uzbekistan | 7.1 /100 | #223 | Tragic 84.6% |
| French American Indians | 6.3 /100 | #224 | Tragic 84.6% |
| Immigrants | Thailand | 5.8 /100 | #225 | Tragic 84.5% |
| Immigrants | Zaire | 5.5 /100 | #226 | Tragic 84.5% |
| Immigrants | Costa Rica | 5.4 /100 | #227 | Tragic 84.5% |
| Immigrants | Liberia | 4.9 /100 | #228 | Tragic 84.4% |
| Immigrants | Uruguay | 4.6 /100 | #229 | Tragic 84.4% |
| Immigrants | Colombia | 4.5 /100 | #230 | Tragic 84.4% |
Demographics Similar to Immigrants from Canada by GED/Equivalency
In terms of ged/equivalency, the demographic groups most similar to Immigrants from Canada are Immigrants from North America (87.8%, a difference of 0.030%), Immigrants from Bulgaria (87.8%, a difference of 0.030%), Immigrants from Turkey (87.9%, a difference of 0.040%), German (87.9%, a difference of 0.050%), and British (87.8%, a difference of 0.050%).
| Demographics | Rating | Rank | GED/Equivalency |
| Immigrants | Czechoslovakia | 99.3 /100 | #57 | Exceptional 87.9% |
| Northern Europeans | 99.3 /100 | #58 | Exceptional 87.9% |
| Serbians | 99.3 /100 | #59 | Exceptional 87.9% |
| Scandinavians | 99.3 /100 | #60 | Exceptional 87.9% |
| Europeans | 99.3 /100 | #61 | Exceptional 87.9% |
| Germans | 99.3 /100 | #62 | Exceptional 87.9% |
| Immigrants | Turkey | 99.2 /100 | #63 | Exceptional 87.9% |
| Immigrants | Canada | 99.2 /100 | #64 | Exceptional 87.9% |
| Immigrants | North America | 99.1 /100 | #65 | Exceptional 87.8% |
| Immigrants | Bulgaria | 99.1 /100 | #66 | Exceptional 87.8% |
| British | 99.1 /100 | #67 | Exceptional 87.8% |
| Immigrants | France | 99.1 /100 | #68 | Exceptional 87.8% |
| Immigrants | Saudi Arabia | 99.0 /100 | #69 | Exceptional 87.8% |
| Ukrainians | 98.8 /100 | #70 | Exceptional 87.7% |
| Austrians | 98.8 /100 | #71 | Exceptional 87.7% |