Czechoslovakian vs Turkish GED/Equivalency
COMPARE
Czechoslovakian
Turkish
GED/Equivalency
GED/Equivalency Comparison
Czechoslovakians
Turks
87.4%
GED/EQUIVALENCY
97.6/ 100
METRIC RATING
96th/ 347
METRIC RANK
88.5%
GED/EQUIVALENCY
99.8/ 100
METRIC RATING
30th/ 347
METRIC RANK
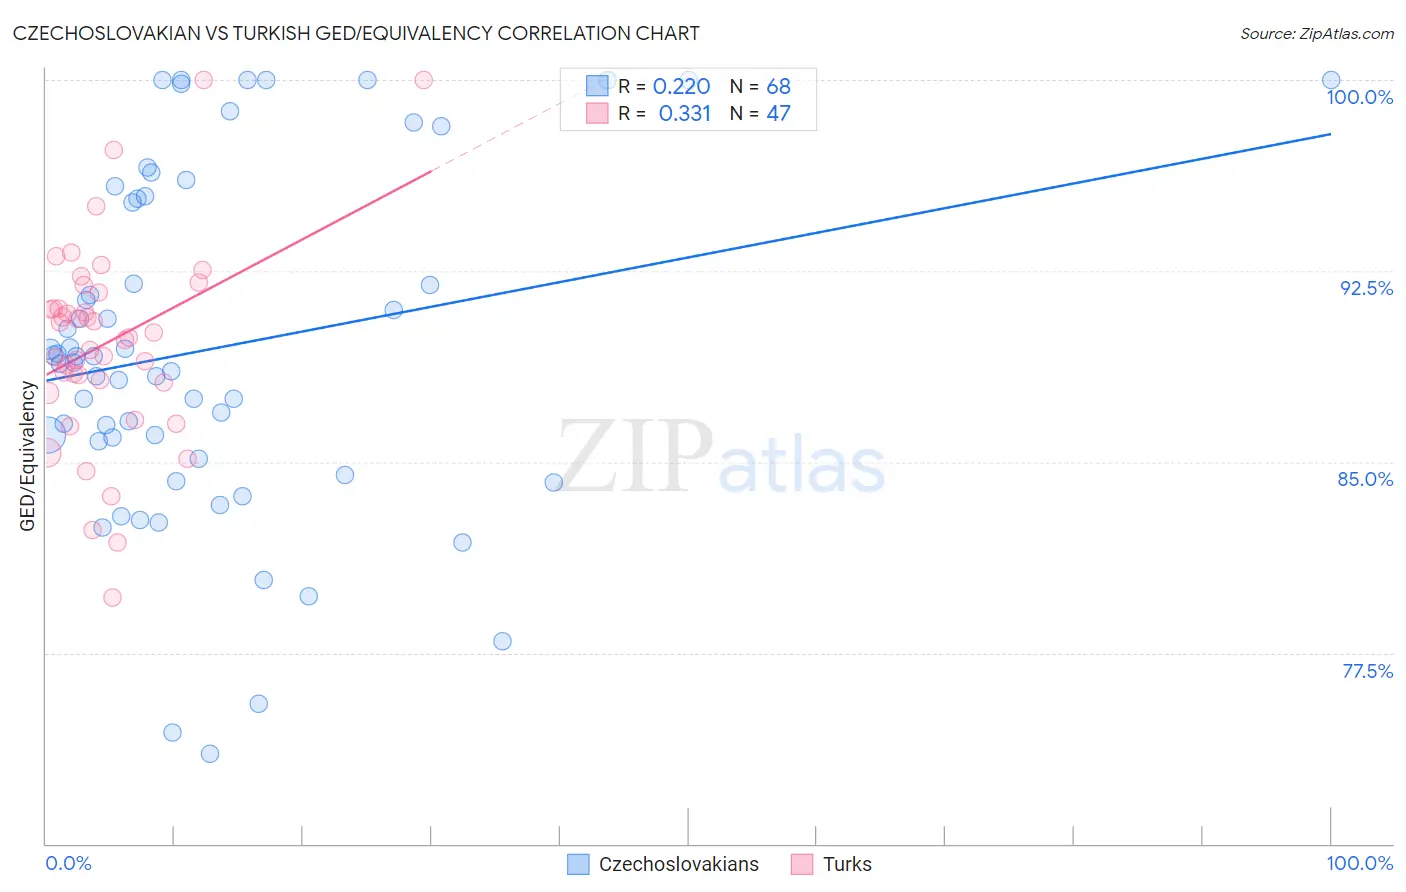
Czechoslovakian vs Turkish GED/Equivalency Correlation Chart
The statistical analysis conducted on geographies consisting of 368,668,598 people shows a weak positive correlation between the proportion of Czechoslovakians and percentage of population with at least ged/equivalency education in the United States with a correlation coefficient (R) of 0.220 and weighted average of 87.4%. Similarly, the statistical analysis conducted on geographies consisting of 271,864,133 people shows a mild positive correlation between the proportion of Turks and percentage of population with at least ged/equivalency education in the United States with a correlation coefficient (R) of 0.331 and weighted average of 88.5%, a difference of 1.2%.
GED/Equivalency Correlation Summary
| Measurement | Czechoslovakian | Turkish |
| Minimum | 73.5% | 79.7% |
| Maximum | 100.0% | 100.0% |
| Range | 26.5% | 20.3% |
| Mean | 89.5% | 89.7% |
| Median | 89.0% | 89.9% |
| Interquartile 25% (IQ1) | 85.5% | 88.1% |
| Interquartile 75% (IQ3) | 95.4% | 91.7% |
| Interquartile Range (IQR) | 9.9% | 3.5% |
| Standard Deviation (Sample) | 6.7% | 4.0% |
| Standard Deviation (Population) | 6.7% | 4.0% |
Similar Demographics by GED/Equivalency
Demographics Similar to Czechoslovakians by GED/Equivalency
In terms of ged/equivalency, the demographic groups most similar to Czechoslovakians are Immigrants from Greece (87.4%, a difference of 0.020%), Immigrants from Russia (87.4%, a difference of 0.030%), Israeli (87.4%, a difference of 0.040%), Immigrants from North Macedonia (87.4%, a difference of 0.040%), and Hungarian (87.4%, a difference of 0.060%).
| Demographics | Rating | Rank | GED/Equivalency |
| Hungarians | 97.9 /100 | #89 | Exceptional 87.4% |
| Welsh | 97.9 /100 | #90 | Exceptional 87.4% |
| Immigrants | Eastern Asia | 97.9 /100 | #91 | Exceptional 87.4% |
| Israelis | 97.8 /100 | #92 | Exceptional 87.4% |
| Immigrants | North Macedonia | 97.8 /100 | #93 | Exceptional 87.4% |
| Immigrants | Russia | 97.8 /100 | #94 | Exceptional 87.4% |
| Immigrants | Greece | 97.7 /100 | #95 | Exceptional 87.4% |
| Czechoslovakians | 97.6 /100 | #96 | Exceptional 87.4% |
| Immigrants | Western Europe | 97.3 /100 | #97 | Exceptional 87.3% |
| Immigrants | Croatia | 96.9 /100 | #98 | Exceptional 87.3% |
| Immigrants | Belarus | 96.9 /100 | #99 | Exceptional 87.3% |
| Palestinians | 96.8 /100 | #100 | Exceptional 87.3% |
| Syrians | 96.6 /100 | #101 | Exceptional 87.2% |
| Lebanese | 96.2 /100 | #102 | Exceptional 87.2% |
| Jordanians | 96.1 /100 | #103 | Exceptional 87.2% |
Demographics Similar to Turks by GED/Equivalency
In terms of ged/equivalency, the demographic groups most similar to Turks are Polish (88.5%, a difference of 0.020%), Bhutanese (88.4%, a difference of 0.030%), Immigrants from Northern Europe (88.5%, a difference of 0.050%), Danish (88.4%, a difference of 0.050%), and Immigrants from Lithuania (88.6%, a difference of 0.090%).
| Demographics | Rating | Rank | GED/Equivalency |
| Russians | 99.8 /100 | #23 | Exceptional 88.6% |
| Slovaks | 99.8 /100 | #24 | Exceptional 88.6% |
| Estonians | 99.8 /100 | #25 | Exceptional 88.6% |
| Immigrants | Australia | 99.8 /100 | #26 | Exceptional 88.6% |
| Immigrants | Lithuania | 99.8 /100 | #27 | Exceptional 88.6% |
| Immigrants | Northern Europe | 99.8 /100 | #28 | Exceptional 88.5% |
| Poles | 99.8 /100 | #29 | Exceptional 88.5% |
| Turks | 99.8 /100 | #30 | Exceptional 88.5% |
| Bhutanese | 99.8 /100 | #31 | Exceptional 88.4% |
| Danes | 99.8 /100 | #32 | Exceptional 88.4% |
| Immigrants | Sweden | 99.7 /100 | #33 | Exceptional 88.4% |
| Immigrants | Japan | 99.7 /100 | #34 | Exceptional 88.4% |
| Immigrants | South Central Asia | 99.7 /100 | #35 | Exceptional 88.4% |
| Immigrants | Belgium | 99.7 /100 | #36 | Exceptional 88.3% |
| Immigrants | Austria | 99.7 /100 | #37 | Exceptional 88.3% |