Immigrants from Uzbekistan vs Turkish Unemployment Among Youth under 25 years
COMPARE
Immigrants from Uzbekistan
Turkish
Unemployment Among Youth under 25 years
Unemployment Among Youth under 25 years Comparison
Immigrants from Uzbekistan
Turks
13.1%
UNEMPLOYMENT AMONG YOUTH UNDER 25 YEARS
0.0/ 100
METRIC RATING
276th/ 347
METRIC RANK
11.4%
UNEMPLOYMENT AMONG YOUTH UNDER 25 YEARS
85.8/ 100
METRIC RATING
129th/ 347
METRIC RANK
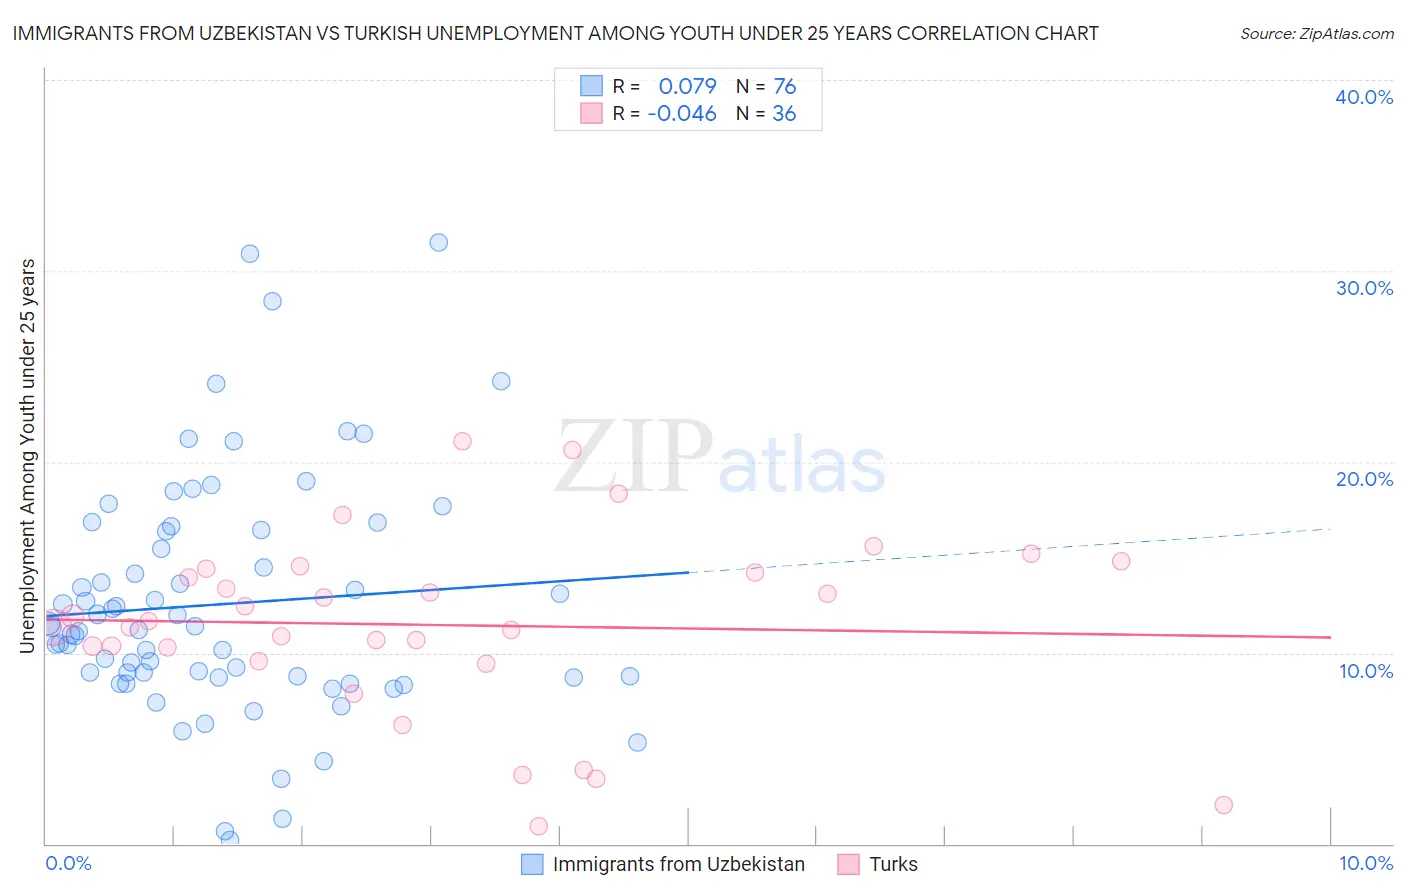
Immigrants from Uzbekistan vs Turkish Unemployment Among Youth under 25 years Correlation Chart
The statistical analysis conducted on geographies consisting of 118,349,257 people shows a slight positive correlation between the proportion of Immigrants from Uzbekistan and unemployment rate among youth under the age of 25 in the United States with a correlation coefficient (R) of 0.079 and weighted average of 13.1%. Similarly, the statistical analysis conducted on geographies consisting of 269,922,235 people shows no correlation between the proportion of Turks and unemployment rate among youth under the age of 25 in the United States with a correlation coefficient (R) of -0.046 and weighted average of 11.4%, a difference of 15.0%.
Unemployment Among Youth under 25 years Correlation Summary
| Measurement | Immigrants from Uzbekistan | Turkish |
| Minimum | 0.20% | 0.90% |
| Maximum | 31.5% | 21.1% |
| Range | 31.3% | 20.2% |
| Mean | 12.5% | 11.5% |
| Median | 11.3% | 11.5% |
| Interquartile 25% (IQ1) | 8.7% | 9.9% |
| Interquartile 75% (IQ3) | 16.4% | 14.3% |
| Interquartile Range (IQR) | 7.6% | 4.4% |
| Standard Deviation (Sample) | 6.2% | 4.7% |
| Standard Deviation (Population) | 6.2% | 4.7% |
Similar Demographics by Unemployment Among Youth under 25 years
Demographics Similar to Immigrants from Uzbekistan by Unemployment Among Youth under 25 years
In terms of unemployment among youth under 25 years, the demographic groups most similar to Immigrants from Uzbekistan are Bahamian (13.1%, a difference of 0.17%), African (13.2%, a difference of 0.42%), Bermudan (13.0%, a difference of 0.43%), Immigrants from Nigeria (13.0%, a difference of 0.54%), and Cajun (13.2%, a difference of 1.1%).
| Demographics | Rating | Rank | Unemployment Among Youth under 25 years |
| Kiowa | 0.0 /100 | #269 | Tragic 12.7% |
| Immigrants | Liberia | 0.0 /100 | #270 | Tragic 12.8% |
| Immigrants | Bahamas | 0.0 /100 | #271 | Tragic 12.9% |
| Cape Verdeans | 0.0 /100 | #272 | Tragic 12.9% |
| Nigerians | 0.0 /100 | #273 | Tragic 13.0% |
| Immigrants | Nigeria | 0.0 /100 | #274 | Tragic 13.0% |
| Bermudans | 0.0 /100 | #275 | Tragic 13.0% |
| Immigrants | Uzbekistan | 0.0 /100 | #276 | Tragic 13.1% |
| Bahamians | 0.0 /100 | #277 | Tragic 13.1% |
| Africans | 0.0 /100 | #278 | Tragic 13.2% |
| Cajuns | 0.0 /100 | #279 | Tragic 13.2% |
| Ute | 0.0 /100 | #280 | Tragic 13.3% |
| Armenians | 0.0 /100 | #281 | Tragic 13.3% |
| Sierra Leoneans | 0.0 /100 | #282 | Tragic 13.3% |
| Immigrants | Cameroon | 0.0 /100 | #283 | Tragic 13.3% |
Demographics Similar to Turks by Unemployment Among Youth under 25 years
In terms of unemployment among youth under 25 years, the demographic groups most similar to Turks are Hungarian (11.4%, a difference of 0.010%), Immigrants from Hungary (11.4%, a difference of 0.020%), Greek (11.4%, a difference of 0.030%), Canadian (11.4%, a difference of 0.070%), and Immigrants from Spain (11.4%, a difference of 0.10%).
| Demographics | Rating | Rank | Unemployment Among Youth under 25 years |
| Immigrants | Micronesia | 88.1 /100 | #122 | Excellent 11.4% |
| Basques | 87.8 /100 | #123 | Excellent 11.4% |
| Italians | 87.2 /100 | #124 | Excellent 11.4% |
| Immigrants | Argentina | 87.2 /100 | #125 | Excellent 11.4% |
| Canadians | 86.6 /100 | #126 | Excellent 11.4% |
| Greeks | 86.2 /100 | #127 | Excellent 11.4% |
| Immigrants | Hungary | 86.0 /100 | #128 | Excellent 11.4% |
| Turks | 85.8 /100 | #129 | Excellent 11.4% |
| Hungarians | 85.7 /100 | #130 | Excellent 11.4% |
| Immigrants | Spain | 84.6 /100 | #131 | Excellent 11.4% |
| Ethiopians | 83.2 /100 | #132 | Excellent 11.4% |
| Lebanese | 83.1 /100 | #133 | Excellent 11.4% |
| Immigrants | Chile | 80.4 /100 | #134 | Excellent 11.4% |
| Immigrants | Oceania | 80.2 /100 | #135 | Excellent 11.4% |
| Romanians | 80.1 /100 | #136 | Excellent 11.4% |