Marshallese vs Turkish GED/Equivalency
COMPARE
Marshallese
Turkish
GED/Equivalency
GED/Equivalency Comparison
Marshallese
Turks
84.9%
GED/EQUIVALENCY
12.5/ 100
METRIC RATING
208th/ 347
METRIC RANK
88.5%
GED/EQUIVALENCY
99.8/ 100
METRIC RATING
30th/ 347
METRIC RANK
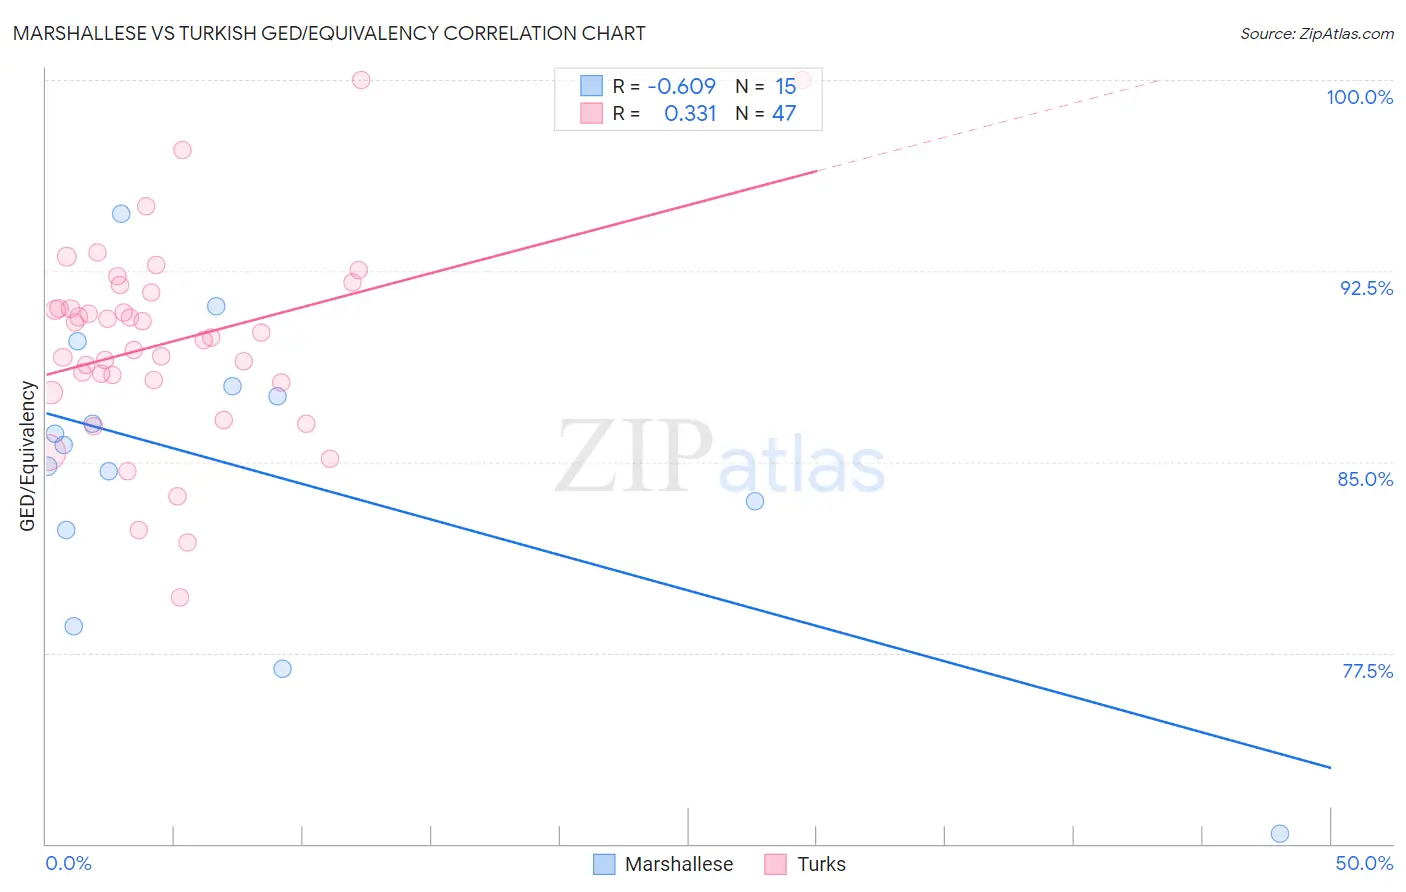
Marshallese vs Turkish GED/Equivalency Correlation Chart
The statistical analysis conducted on geographies consisting of 14,760,991 people shows a significant negative correlation between the proportion of Marshallese and percentage of population with at least ged/equivalency education in the United States with a correlation coefficient (R) of -0.609 and weighted average of 84.9%. Similarly, the statistical analysis conducted on geographies consisting of 271,864,133 people shows a mild positive correlation between the proportion of Turks and percentage of population with at least ged/equivalency education in the United States with a correlation coefficient (R) of 0.331 and weighted average of 88.5%, a difference of 4.2%.
GED/Equivalency Correlation Summary
| Measurement | Marshallese | Turkish |
| Minimum | 70.4% | 79.7% |
| Maximum | 94.8% | 100.0% |
| Range | 24.4% | 20.3% |
| Mean | 84.7% | 89.7% |
| Median | 85.7% | 89.9% |
| Interquartile 25% (IQ1) | 82.3% | 88.1% |
| Interquartile 75% (IQ3) | 88.0% | 91.7% |
| Interquartile Range (IQR) | 5.6% | 3.5% |
| Standard Deviation (Sample) | 6.0% | 4.0% |
| Standard Deviation (Population) | 5.8% | 4.0% |
Similar Demographics by GED/Equivalency
Demographics Similar to Marshallese by GED/Equivalency
In terms of ged/equivalency, the demographic groups most similar to Marshallese are Colombian (84.9%, a difference of 0.010%), Immigrants from Cameroon (84.9%, a difference of 0.020%), Hmong (84.9%, a difference of 0.030%), Samoan (84.9%, a difference of 0.050%), and South American (84.8%, a difference of 0.080%).
| Demographics | Rating | Rank | GED/Equivalency |
| Portuguese | 15.9 /100 | #201 | Poor 85.0% |
| Cree | 15.9 /100 | #202 | Poor 85.0% |
| Panamanians | 15.3 /100 | #203 | Poor 85.0% |
| Hawaiians | 15.2 /100 | #204 | Poor 85.0% |
| Liberians | 14.6 /100 | #205 | Poor 85.0% |
| Samoans | 13.7 /100 | #206 | Poor 84.9% |
| Hmong | 13.1 /100 | #207 | Poor 84.9% |
| Marshallese | 12.5 /100 | #208 | Poor 84.9% |
| Colombians | 12.3 /100 | #209 | Poor 84.9% |
| Immigrants | Cameroon | 12.1 /100 | #210 | Poor 84.9% |
| South Americans | 10.9 /100 | #211 | Poor 84.8% |
| Immigrants | Somalia | 10.6 /100 | #212 | Poor 84.8% |
| Immigrants | Philippines | 10.0 /100 | #213 | Poor 84.8% |
| Osage | 9.5 /100 | #214 | Tragic 84.8% |
| Peruvians | 9.2 /100 | #215 | Tragic 84.7% |
Demographics Similar to Turks by GED/Equivalency
In terms of ged/equivalency, the demographic groups most similar to Turks are Polish (88.5%, a difference of 0.020%), Bhutanese (88.4%, a difference of 0.030%), Immigrants from Northern Europe (88.5%, a difference of 0.050%), Danish (88.4%, a difference of 0.050%), and Immigrants from Lithuania (88.6%, a difference of 0.090%).
| Demographics | Rating | Rank | GED/Equivalency |
| Russians | 99.8 /100 | #23 | Exceptional 88.6% |
| Slovaks | 99.8 /100 | #24 | Exceptional 88.6% |
| Estonians | 99.8 /100 | #25 | Exceptional 88.6% |
| Immigrants | Australia | 99.8 /100 | #26 | Exceptional 88.6% |
| Immigrants | Lithuania | 99.8 /100 | #27 | Exceptional 88.6% |
| Immigrants | Northern Europe | 99.8 /100 | #28 | Exceptional 88.5% |
| Poles | 99.8 /100 | #29 | Exceptional 88.5% |
| Turks | 99.8 /100 | #30 | Exceptional 88.5% |
| Bhutanese | 99.8 /100 | #31 | Exceptional 88.4% |
| Danes | 99.8 /100 | #32 | Exceptional 88.4% |
| Immigrants | Sweden | 99.7 /100 | #33 | Exceptional 88.4% |
| Immigrants | Japan | 99.7 /100 | #34 | Exceptional 88.4% |
| Immigrants | South Central Asia | 99.7 /100 | #35 | Exceptional 88.4% |
| Immigrants | Belgium | 99.7 /100 | #36 | Exceptional 88.3% |
| Immigrants | Austria | 99.7 /100 | #37 | Exceptional 88.3% |