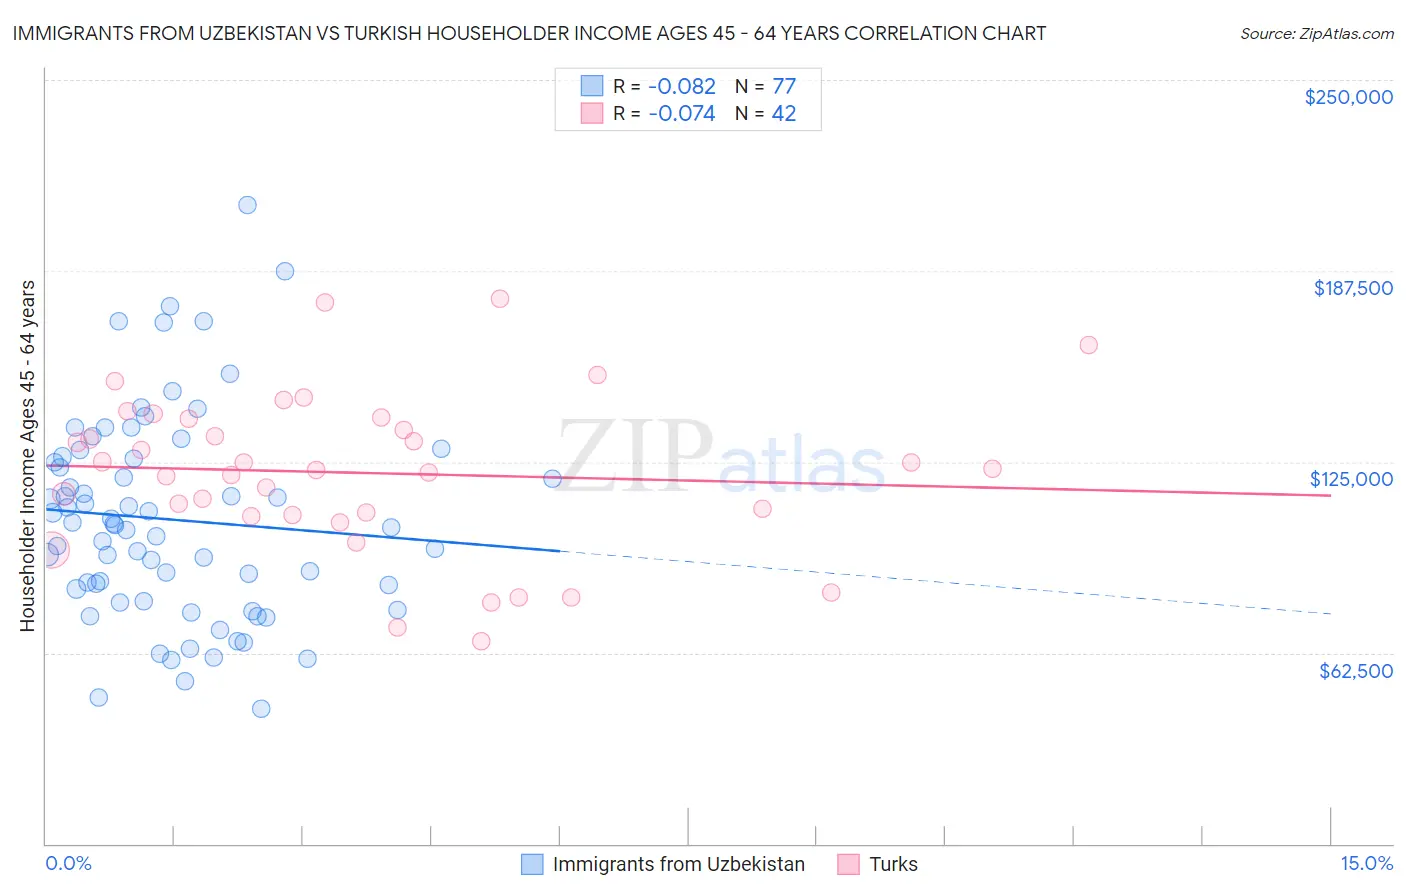
Immigrants from Uzbekistan vs Turkish Householder Income Ages 45 - 64 years
COMPARE
Immigrants from Uzbekistan
Turkish
Householder Income Ages 45 - 64 years
Householder Income Ages 45 - 64 years Comparison
Immigrants from Uzbekistan
Turks
$100,523
HOUSEHOLDER INCOME AGES 45 - 64 YEARS
52.5/ 100
METRIC RATING
172nd/ 347
METRIC RANK
$117,814
HOUSEHOLDER INCOME AGES 45 - 64 YEARS
100.0/ 100
METRIC RATING
28th/ 347
METRIC RANK
Immigrants from Uzbekistan vs Turkish Householder Income Ages 45 - 64 years Correlation Chart
The statistical analysis conducted on geographies consisting of 118,644,121 people shows a slight negative correlation between the proportion of Immigrants from Uzbekistan and household income with householder between the ages 45 and 64 in the United States with a correlation coefficient (R) of -0.082 and weighted average of $100,523. Similarly, the statistical analysis conducted on geographies consisting of 271,498,230 people shows a slight negative correlation between the proportion of Turks and household income with householder between the ages 45 and 64 in the United States with a correlation coefficient (R) of -0.074 and weighted average of $117,814, a difference of 17.2%.
Householder Income Ages 45 - 64 years Correlation Summary
| Measurement | Immigrants from Uzbekistan | Turkish |
| Minimum | $44,028 | $66,250 |
| Maximum | $209,232 | $178,523 |
| Range | $165,204 | $112,273 |
| Mean | $106,089 | $121,410 |
| Median | $104,321 | $122,614 |
| Interquartile 25% (IQ1) | $81,393 | $107,799 |
| Interquartile 75% (IQ3) | $126,326 | $139,122 |
| Interquartile Range (IQR) | $44,934 | $31,324 |
| Standard Deviation (Sample) | $33,612 | $26,168 |
| Standard Deviation (Population) | $33,393 | $25,855 |
Similar Demographics by Householder Income Ages 45 - 64 years
Demographics Similar to Immigrants from Uzbekistan by Householder Income Ages 45 - 64 years
In terms of householder income ages 45 - 64 years, the demographic groups most similar to Immigrants from Uzbekistan are Alsatian ($100,435, a difference of 0.090%), Welsh ($100,322, a difference of 0.20%), German ($100,224, a difference of 0.30%), South American ($100,837, a difference of 0.31%), and Immigrants from Costa Rica ($100,141, a difference of 0.38%).
| Demographics | Rating | Rank | Householder Income Ages 45 - 64 years |
| Immigrants | Albania | 69.4 /100 | #165 | Good $101,957 |
| Samoans | 65.3 /100 | #166 | Good $101,580 |
| Czechoslovakians | 63.0 /100 | #167 | Good $101,387 |
| South American Indians | 60.5 /100 | #168 | Good $101,171 |
| Guamanians/Chamorros | 60.5 /100 | #169 | Good $101,170 |
| Slovaks | 58.8 /100 | #170 | Average $101,029 |
| South Americans | 56.4 /100 | #171 | Average $100,837 |
| Immigrants | Uzbekistan | 52.5 /100 | #172 | Average $100,523 |
| Alsatians | 51.4 /100 | #173 | Average $100,435 |
| Welsh | 50.0 /100 | #174 | Average $100,322 |
| Germans | 48.8 /100 | #175 | Average $100,224 |
| Immigrants | Costa Rica | 47.7 /100 | #176 | Average $100,141 |
| Moroccans | 47.7 /100 | #177 | Average $100,138 |
| Immigrants | Cameroon | 47.0 /100 | #178 | Average $100,084 |
| Belgians | 46.7 /100 | #179 | Average $100,060 |
Demographics Similar to Turks by Householder Income Ages 45 - 64 years
In terms of householder income ages 45 - 64 years, the demographic groups most similar to Turks are Bhutanese ($117,750, a difference of 0.050%), Immigrants from Bolivia ($117,731, a difference of 0.070%), Immigrants from Northern Europe ($117,930, a difference of 0.10%), Immigrants from Sweden ($118,318, a difference of 0.43%), and Asian ($118,426, a difference of 0.52%).
| Demographics | Rating | Rank | Householder Income Ages 45 - 64 years |
| Immigrants | Sri Lanka | 100.0 /100 | #21 | Exceptional $119,094 |
| Immigrants | Belgium | 100.0 /100 | #22 | Exceptional $118,932 |
| Bolivians | 100.0 /100 | #23 | Exceptional $118,871 |
| Immigrants | Japan | 100.0 /100 | #24 | Exceptional $118,498 |
| Asians | 100.0 /100 | #25 | Exceptional $118,426 |
| Immigrants | Sweden | 100.0 /100 | #26 | Exceptional $118,318 |
| Immigrants | Northern Europe | 100.0 /100 | #27 | Exceptional $117,930 |
| Turks | 100.0 /100 | #28 | Exceptional $117,814 |
| Bhutanese | 100.0 /100 | #29 | Exceptional $117,750 |
| Immigrants | Bolivia | 100.0 /100 | #30 | Exceptional $117,731 |
| Immigrants | Asia | 100.0 /100 | #31 | Exceptional $116,566 |
| Russians | 100.0 /100 | #32 | Exceptional $116,328 |
| Chinese | 100.0 /100 | #33 | Exceptional $116,156 |
| Immigrants | Denmark | 100.0 /100 | #34 | Exceptional $116,000 |
| Latvians | 100.0 /100 | #35 | Exceptional $115,957 |