Immigrants from Uzbekistan vs Immigrants from Belize GED/Equivalency
COMPARE
Immigrants from Uzbekistan
Immigrants from Belize
GED/Equivalency
GED/Equivalency Comparison
Immigrants from Uzbekistan
Immigrants from Belize
84.6%
GED/EQUIVALENCY
7.1/ 100
METRIC RATING
223rd/ 347
METRIC RANK
80.5%
GED/EQUIVALENCY
0.0/ 100
METRIC RATING
319th/ 347
METRIC RANK
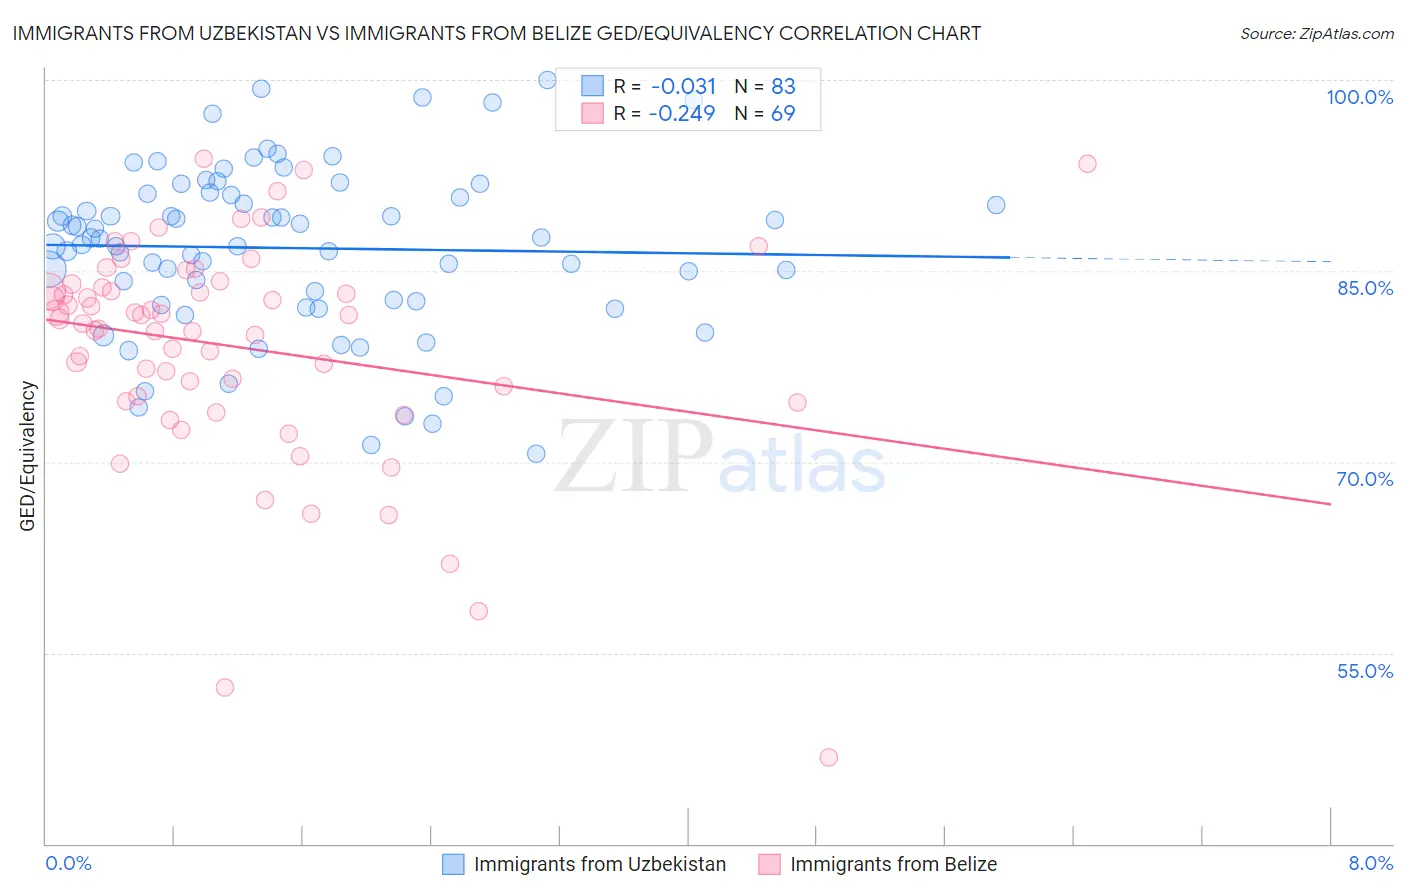
Immigrants from Uzbekistan vs Immigrants from Belize GED/Equivalency Correlation Chart
The statistical analysis conducted on geographies consisting of 118,765,305 people shows no correlation between the proportion of Immigrants from Uzbekistan and percentage of population with at least ged/equivalency education in the United States with a correlation coefficient (R) of -0.031 and weighted average of 84.6%. Similarly, the statistical analysis conducted on geographies consisting of 130,250,151 people shows a weak negative correlation between the proportion of Immigrants from Belize and percentage of population with at least ged/equivalency education in the United States with a correlation coefficient (R) of -0.249 and weighted average of 80.5%, a difference of 5.1%.
GED/Equivalency Correlation Summary
| Measurement | Immigrants from Uzbekistan | Immigrants from Belize |
| Minimum | 70.7% | 46.8% |
| Maximum | 100.0% | 93.8% |
| Range | 29.3% | 47.0% |
| Mean | 86.8% | 79.0% |
| Median | 87.6% | 81.2% |
| Interquartile 25% (IQ1) | 82.6% | 75.0% |
| Interquartile 75% (IQ3) | 91.1% | 83.8% |
| Interquartile Range (IQR) | 8.5% | 8.9% |
| Standard Deviation (Sample) | 6.6% | 8.8% |
| Standard Deviation (Population) | 6.5% | 8.7% |
Similar Demographics by GED/Equivalency
Demographics Similar to Immigrants from Uzbekistan by GED/Equivalency
In terms of ged/equivalency, the demographic groups most similar to Immigrants from Uzbekistan are Iroquois (84.6%, a difference of 0.030%), Taiwanese (84.7%, a difference of 0.070%), French American Indian (84.6%, a difference of 0.070%), Potawatomi (84.7%, a difference of 0.080%), and American (84.7%, a difference of 0.080%).
| Demographics | Rating | Rank | GED/Equivalency |
| Immigrants | Micronesia | 8.7 /100 | #216 | Tragic 84.7% |
| Nigerians | 8.6 /100 | #217 | Tragic 84.7% |
| Alaska Natives | 8.6 /100 | #218 | Tragic 84.7% |
| Potawatomi | 8.2 /100 | #219 | Tragic 84.7% |
| Americans | 8.2 /100 | #220 | Tragic 84.7% |
| Taiwanese | 8.1 /100 | #221 | Tragic 84.7% |
| Iroquois | 7.5 /100 | #222 | Tragic 84.6% |
| Immigrants | Uzbekistan | 7.1 /100 | #223 | Tragic 84.6% |
| French American Indians | 6.3 /100 | #224 | Tragic 84.6% |
| Immigrants | Thailand | 5.8 /100 | #225 | Tragic 84.5% |
| Immigrants | Zaire | 5.5 /100 | #226 | Tragic 84.5% |
| Immigrants | Costa Rica | 5.4 /100 | #227 | Tragic 84.5% |
| Immigrants | Liberia | 4.9 /100 | #228 | Tragic 84.4% |
| Immigrants | Uruguay | 4.6 /100 | #229 | Tragic 84.4% |
| Immigrants | Colombia | 4.5 /100 | #230 | Tragic 84.4% |
Demographics Similar to Immigrants from Belize by GED/Equivalency
In terms of ged/equivalency, the demographic groups most similar to Immigrants from Belize are Yaqui (80.5%, a difference of 0.0%), Immigrants from Caribbean (80.5%, a difference of 0.020%), Central American Indian (80.6%, a difference of 0.13%), Apache (80.7%, a difference of 0.26%), and Immigrants from Cuba (80.2%, a difference of 0.41%).
| Demographics | Rating | Rank | GED/Equivalency |
| Nicaraguans | 0.0 /100 | #312 | Tragic 80.9% |
| Cape Verdeans | 0.0 /100 | #313 | Tragic 80.9% |
| Belizeans | 0.0 /100 | #314 | Tragic 80.9% |
| Apache | 0.0 /100 | #315 | Tragic 80.7% |
| Central American Indians | 0.0 /100 | #316 | Tragic 80.6% |
| Immigrants | Caribbean | 0.0 /100 | #317 | Tragic 80.5% |
| Yaqui | 0.0 /100 | #318 | Tragic 80.5% |
| Immigrants | Belize | 0.0 /100 | #319 | Tragic 80.5% |
| Immigrants | Cuba | 0.0 /100 | #320 | Tragic 80.2% |
| Yup'ik | 0.0 /100 | #321 | Tragic 80.0% |
| Lumbee | 0.0 /100 | #322 | Tragic 80.0% |
| Immigrants | Nicaragua | 0.0 /100 | #323 | Tragic 79.9% |
| Mexican American Indians | 0.0 /100 | #324 | Tragic 79.4% |
| Hondurans | 0.0 /100 | #325 | Tragic 79.3% |
| Yuman | 0.0 /100 | #326 | Tragic 79.2% |