Immigrants from Sierra Leone vs Immigrants from Kenya GED/Equivalency
COMPARE
Immigrants from Sierra Leone
Immigrants from Kenya
GED/Equivalency
GED/Equivalency Comparison
Immigrants from Sierra Leone
Immigrants from Kenya
85.4%
GED/EQUIVALENCY
29.0/ 100
METRIC RATING
188th/ 347
METRIC RANK
86.2%
GED/EQUIVALENCY
71.8/ 100
METRIC RATING
159th/ 347
METRIC RANK
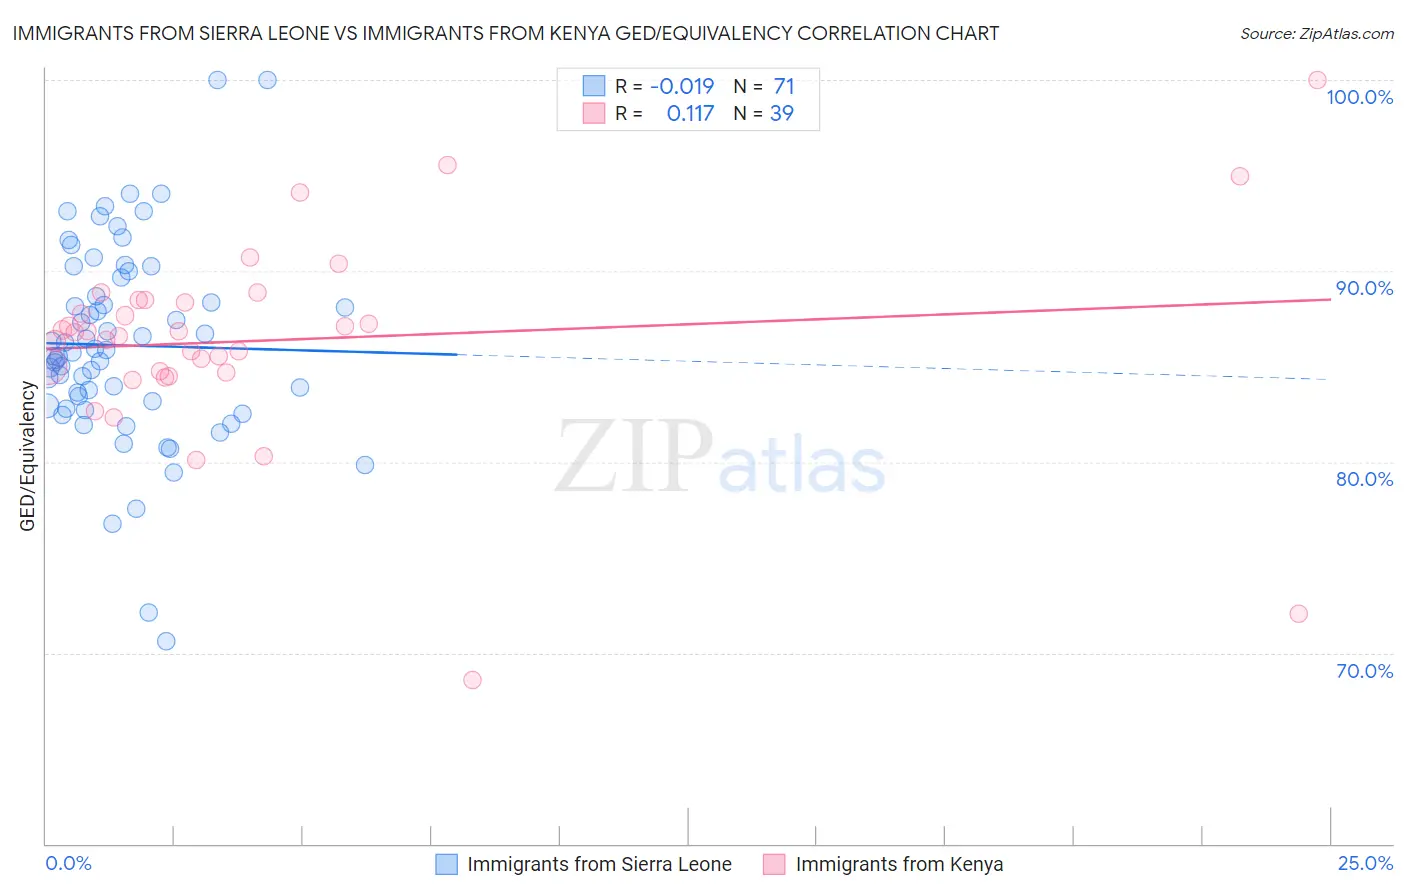
Immigrants from Sierra Leone vs Immigrants from Kenya GED/Equivalency Correlation Chart
The statistical analysis conducted on geographies consisting of 101,654,421 people shows no correlation between the proportion of Immigrants from Sierra Leone and percentage of population with at least ged/equivalency education in the United States with a correlation coefficient (R) of -0.019 and weighted average of 85.4%. Similarly, the statistical analysis conducted on geographies consisting of 218,076,690 people shows a poor positive correlation between the proportion of Immigrants from Kenya and percentage of population with at least ged/equivalency education in the United States with a correlation coefficient (R) of 0.117 and weighted average of 86.2%, a difference of 0.94%.
GED/Equivalency Correlation Summary
| Measurement | Immigrants from Sierra Leone | Immigrants from Kenya |
| Minimum | 70.6% | 68.6% |
| Maximum | 100.0% | 100.0% |
| Range | 29.4% | 31.4% |
| Mean | 86.1% | 86.4% |
| Median | 85.7% | 86.8% |
| Interquartile 25% (IQ1) | 82.9% | 84.7% |
| Interquartile 75% (IQ3) | 89.6% | 88.5% |
| Interquartile Range (IQR) | 6.7% | 3.8% |
| Standard Deviation (Sample) | 5.2% | 5.4% |
| Standard Deviation (Population) | 5.2% | 5.4% |
Similar Demographics by GED/Equivalency
Demographics Similar to Immigrants from Sierra Leone by GED/Equivalency
In terms of ged/equivalency, the demographic groups most similar to Immigrants from Sierra Leone are Guamanian/Chamorro (85.3%, a difference of 0.010%), Immigrants from Afghanistan (85.4%, a difference of 0.020%), Alaskan Athabascan (85.3%, a difference of 0.040%), Spaniard (85.4%, a difference of 0.070%), and Spanish (85.4%, a difference of 0.090%).
| Demographics | Rating | Rank | GED/Equivalency |
| Moroccans | 37.7 /100 | #181 | Fair 85.5% |
| Sudanese | 35.2 /100 | #182 | Fair 85.5% |
| Immigrants | Sudan | 34.2 /100 | #183 | Fair 85.5% |
| Immigrants | Oceania | 33.6 /100 | #184 | Fair 85.5% |
| Spanish | 32.8 /100 | #185 | Fair 85.4% |
| Spaniards | 31.9 /100 | #186 | Fair 85.4% |
| Immigrants | Afghanistan | 29.8 /100 | #187 | Fair 85.4% |
| Immigrants | Sierra Leone | 29.0 /100 | #188 | Fair 85.4% |
| Guamanians/Chamorros | 28.4 /100 | #189 | Fair 85.3% |
| Alaskan Athabascans | 27.5 /100 | #190 | Fair 85.3% |
| South American Indians | 22.8 /100 | #191 | Fair 85.2% |
| Immigrants | Nonimmigrants | 22.7 /100 | #192 | Fair 85.2% |
| Delaware | 22.2 /100 | #193 | Fair 85.2% |
| Puget Sound Salish | 20.8 /100 | #194 | Fair 85.2% |
| Chippewa | 20.8 /100 | #195 | Fair 85.2% |
Demographics Similar to Immigrants from Kenya by GED/Equivalency
In terms of ged/equivalency, the demographic groups most similar to Immigrants from Kenya are White/Caucasian (86.2%, a difference of 0.010%), German Russian (86.2%, a difference of 0.010%), Immigrants from Nepal (86.2%, a difference of 0.040%), Immigrants from Morocco (86.1%, a difference of 0.060%), and Immigrants from Syria (86.1%, a difference of 0.060%).
| Demographics | Rating | Rank | GED/Equivalency |
| Brazilians | 77.2 /100 | #152 | Good 86.3% |
| Kenyans | 76.6 /100 | #153 | Good 86.3% |
| Armenians | 76.4 /100 | #154 | Good 86.3% |
| Iraqis | 75.2 /100 | #155 | Good 86.2% |
| Immigrants | Nepal | 73.3 /100 | #156 | Good 86.2% |
| Whites/Caucasians | 72.2 /100 | #157 | Good 86.2% |
| German Russians | 72.1 /100 | #158 | Good 86.2% |
| Immigrants | Kenya | 71.8 /100 | #159 | Good 86.2% |
| Immigrants | Morocco | 69.5 /100 | #160 | Good 86.1% |
| Immigrants | Syria | 69.3 /100 | #161 | Good 86.1% |
| Immigrants | Iraq | 68.1 /100 | #162 | Good 86.1% |
| Ugandans | 66.3 /100 | #163 | Good 86.1% |
| Venezuelans | 65.5 /100 | #164 | Good 86.0% |
| Alsatians | 64.3 /100 | #165 | Good 86.0% |
| Immigrants | Albania | 64.2 /100 | #166 | Good 86.0% |