Immigrants from Sierra Leone vs Bahamian GED/Equivalency
COMPARE
Immigrants from Sierra Leone
Bahamian
GED/Equivalency
GED/Equivalency Comparison
Immigrants from Sierra Leone
Bahamians
85.4%
GED/EQUIVALENCY
29.0/ 100
METRIC RATING
188th/ 347
METRIC RANK
83.6%
GED/EQUIVALENCY
0.8/ 100
METRIC RATING
252nd/ 347
METRIC RANK
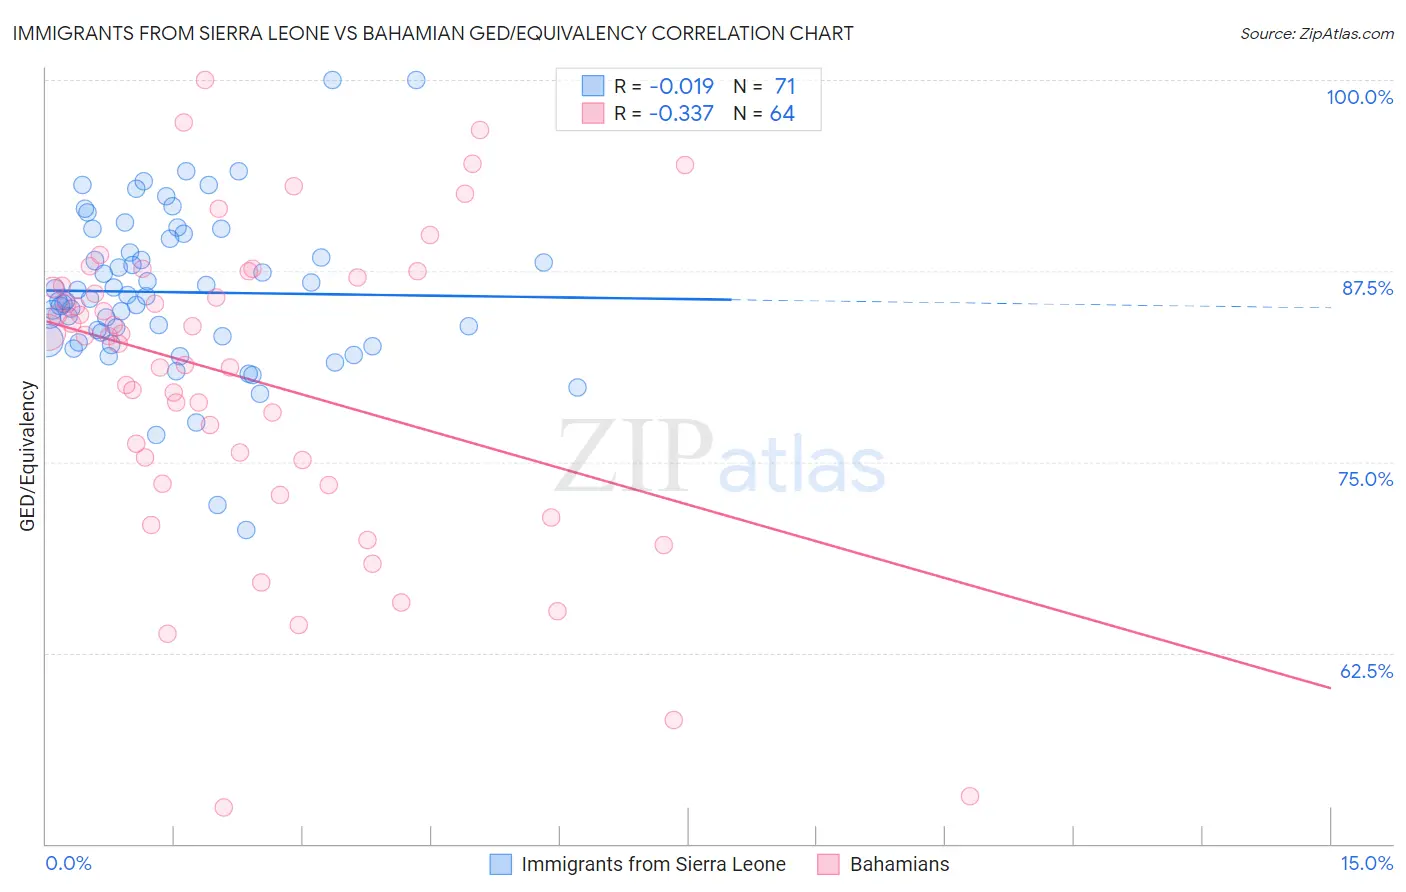
Immigrants from Sierra Leone vs Bahamian GED/Equivalency Correlation Chart
The statistical analysis conducted on geographies consisting of 101,654,421 people shows no correlation between the proportion of Immigrants from Sierra Leone and percentage of population with at least ged/equivalency education in the United States with a correlation coefficient (R) of -0.019 and weighted average of 85.4%. Similarly, the statistical analysis conducted on geographies consisting of 112,707,159 people shows a mild negative correlation between the proportion of Bahamians and percentage of population with at least ged/equivalency education in the United States with a correlation coefficient (R) of -0.337 and weighted average of 83.6%, a difference of 2.1%.
GED/Equivalency Correlation Summary
| Measurement | Immigrants from Sierra Leone | Bahamian |
| Minimum | 70.6% | 52.4% |
| Maximum | 100.0% | 100.0% |
| Range | 29.4% | 47.6% |
| Mean | 86.1% | 80.4% |
| Median | 85.7% | 83.2% |
| Interquartile 25% (IQ1) | 82.9% | 74.4% |
| Interquartile 75% (IQ3) | 89.6% | 86.8% |
| Interquartile Range (IQR) | 6.7% | 12.5% |
| Standard Deviation (Sample) | 5.2% | 10.2% |
| Standard Deviation (Population) | 5.2% | 10.1% |
Similar Demographics by GED/Equivalency
Demographics Similar to Immigrants from Sierra Leone by GED/Equivalency
In terms of ged/equivalency, the demographic groups most similar to Immigrants from Sierra Leone are Guamanian/Chamorro (85.3%, a difference of 0.010%), Immigrants from Afghanistan (85.4%, a difference of 0.020%), Alaskan Athabascan (85.3%, a difference of 0.040%), Spaniard (85.4%, a difference of 0.070%), and Spanish (85.4%, a difference of 0.090%).
| Demographics | Rating | Rank | GED/Equivalency |
| Moroccans | 37.7 /100 | #181 | Fair 85.5% |
| Sudanese | 35.2 /100 | #182 | Fair 85.5% |
| Immigrants | Sudan | 34.2 /100 | #183 | Fair 85.5% |
| Immigrants | Oceania | 33.6 /100 | #184 | Fair 85.5% |
| Spanish | 32.8 /100 | #185 | Fair 85.4% |
| Spaniards | 31.9 /100 | #186 | Fair 85.4% |
| Immigrants | Afghanistan | 29.8 /100 | #187 | Fair 85.4% |
| Immigrants | Sierra Leone | 29.0 /100 | #188 | Fair 85.4% |
| Guamanians/Chamorros | 28.4 /100 | #189 | Fair 85.3% |
| Alaskan Athabascans | 27.5 /100 | #190 | Fair 85.3% |
| South American Indians | 22.8 /100 | #191 | Fair 85.2% |
| Immigrants | Nonimmigrants | 22.7 /100 | #192 | Fair 85.2% |
| Delaware | 22.2 /100 | #193 | Fair 85.2% |
| Puget Sound Salish | 20.8 /100 | #194 | Fair 85.2% |
| Chippewa | 20.8 /100 | #195 | Fair 85.2% |
Demographics Similar to Bahamians by GED/Equivalency
In terms of ged/equivalency, the demographic groups most similar to Bahamians are Spanish American (83.6%, a difference of 0.0%), Comanche (83.6%, a difference of 0.060%), Creek (83.6%, a difference of 0.090%), Shoshone (83.7%, a difference of 0.15%), and Blackfeet (83.8%, a difference of 0.17%).
| Demographics | Rating | Rank | GED/Equivalency |
| Immigrants | Senegal | 1.2 /100 | #245 | Tragic 83.8% |
| Chickasaw | 1.2 /100 | #246 | Tragic 83.8% |
| Immigrants | Western Africa | 1.1 /100 | #247 | Tragic 83.8% |
| Blackfeet | 1.1 /100 | #248 | Tragic 83.8% |
| Crow | 1.1 /100 | #249 | Tragic 83.8% |
| Shoshone | 1.0 /100 | #250 | Tragic 83.7% |
| Spanish Americans | 0.8 /100 | #251 | Tragic 83.6% |
| Bahamians | 0.8 /100 | #252 | Tragic 83.6% |
| Comanche | 0.7 /100 | #253 | Tragic 83.6% |
| Creek | 0.7 /100 | #254 | Tragic 83.6% |
| Colville | 0.5 /100 | #255 | Tragic 83.4% |
| Africans | 0.5 /100 | #256 | Tragic 83.4% |
| Jamaicans | 0.4 /100 | #257 | Tragic 83.3% |
| Malaysians | 0.4 /100 | #258 | Tragic 83.3% |
| Immigrants | Vietnam | 0.3 /100 | #259 | Tragic 83.2% |