Immigrants from Sierra Leone vs Immigrants from Guyana GED/Equivalency
COMPARE
Immigrants from Sierra Leone
Immigrants from Guyana
GED/Equivalency
GED/Equivalency Comparison
Immigrants from Sierra Leone
Immigrants from Guyana
85.4%
GED/EQUIVALENCY
29.0/ 100
METRIC RATING
188th/ 347
METRIC RANK
81.0%
GED/EQUIVALENCY
0.0/ 100
METRIC RATING
310th/ 347
METRIC RANK
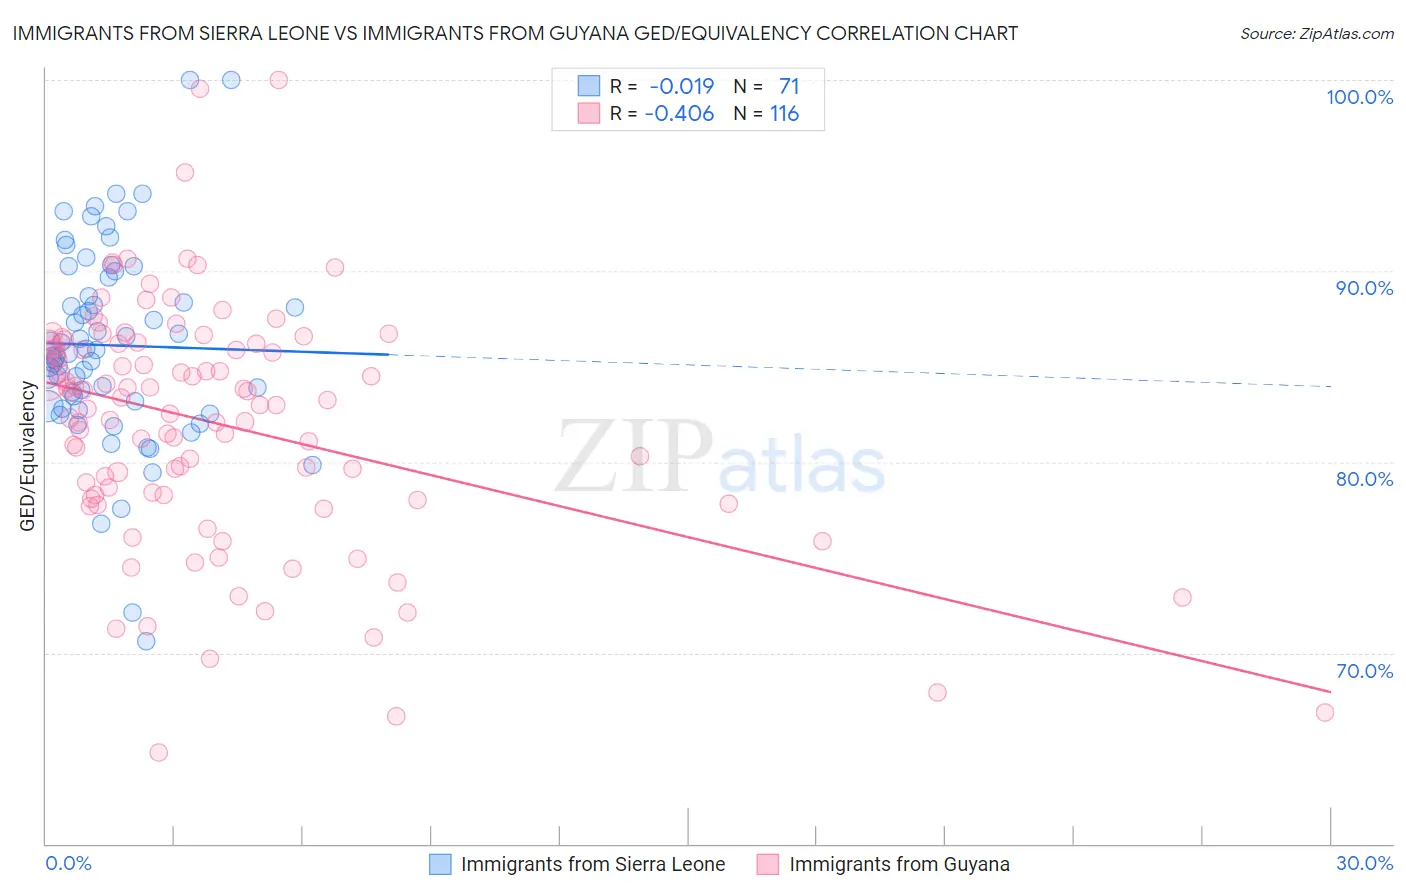
Immigrants from Sierra Leone vs Immigrants from Guyana GED/Equivalency Correlation Chart
The statistical analysis conducted on geographies consisting of 101,654,421 people shows no correlation between the proportion of Immigrants from Sierra Leone and percentage of population with at least ged/equivalency education in the United States with a correlation coefficient (R) of -0.019 and weighted average of 85.4%. Similarly, the statistical analysis conducted on geographies consisting of 183,746,342 people shows a moderate negative correlation between the proportion of Immigrants from Guyana and percentage of population with at least ged/equivalency education in the United States with a correlation coefficient (R) of -0.406 and weighted average of 81.0%, a difference of 5.4%.
GED/Equivalency Correlation Summary
| Measurement | Immigrants from Sierra Leone | Immigrants from Guyana |
| Minimum | 70.6% | 64.8% |
| Maximum | 100.0% | 100.0% |
| Range | 29.4% | 35.2% |
| Mean | 86.1% | 82.0% |
| Median | 85.7% | 83.1% |
| Interquartile 25% (IQ1) | 82.9% | 78.3% |
| Interquartile 75% (IQ3) | 89.6% | 86.2% |
| Interquartile Range (IQR) | 6.7% | 7.9% |
| Standard Deviation (Sample) | 5.2% | 6.3% |
| Standard Deviation (Population) | 5.2% | 6.2% |
Similar Demographics by GED/Equivalency
Demographics Similar to Immigrants from Sierra Leone by GED/Equivalency
In terms of ged/equivalency, the demographic groups most similar to Immigrants from Sierra Leone are Guamanian/Chamorro (85.3%, a difference of 0.010%), Immigrants from Afghanistan (85.4%, a difference of 0.020%), Alaskan Athabascan (85.3%, a difference of 0.040%), Spaniard (85.4%, a difference of 0.070%), and Spanish (85.4%, a difference of 0.090%).
| Demographics | Rating | Rank | GED/Equivalency |
| Moroccans | 37.7 /100 | #181 | Fair 85.5% |
| Sudanese | 35.2 /100 | #182 | Fair 85.5% |
| Immigrants | Sudan | 34.2 /100 | #183 | Fair 85.5% |
| Immigrants | Oceania | 33.6 /100 | #184 | Fair 85.5% |
| Spanish | 32.8 /100 | #185 | Fair 85.4% |
| Spaniards | 31.9 /100 | #186 | Fair 85.4% |
| Immigrants | Afghanistan | 29.8 /100 | #187 | Fair 85.4% |
| Immigrants | Sierra Leone | 29.0 /100 | #188 | Fair 85.4% |
| Guamanians/Chamorros | 28.4 /100 | #189 | Fair 85.3% |
| Alaskan Athabascans | 27.5 /100 | #190 | Fair 85.3% |
| South American Indians | 22.8 /100 | #191 | Fair 85.2% |
| Immigrants | Nonimmigrants | 22.7 /100 | #192 | Fair 85.2% |
| Delaware | 22.2 /100 | #193 | Fair 85.2% |
| Puget Sound Salish | 20.8 /100 | #194 | Fair 85.2% |
| Chippewa | 20.8 /100 | #195 | Fair 85.2% |
Demographics Similar to Immigrants from Guyana by GED/Equivalency
In terms of ged/equivalency, the demographic groups most similar to Immigrants from Guyana are Native/Alaskan (80.9%, a difference of 0.0%), Nicaraguan (80.9%, a difference of 0.040%), Cape Verdean (80.9%, a difference of 0.040%), Immigrants from Ecuador (81.0%, a difference of 0.060%), and Belizean (80.9%, a difference of 0.060%).
| Demographics | Rating | Rank | GED/Equivalency |
| Immigrants | Portugal | 0.0 /100 | #303 | Tragic 81.6% |
| Navajo | 0.0 /100 | #304 | Tragic 81.5% |
| Immigrants | Grenada | 0.0 /100 | #305 | Tragic 81.3% |
| Guyanese | 0.0 /100 | #306 | Tragic 81.3% |
| Immigrants | Dominica | 0.0 /100 | #307 | Tragic 81.1% |
| Puerto Ricans | 0.0 /100 | #308 | Tragic 81.1% |
| Immigrants | Ecuador | 0.0 /100 | #309 | Tragic 81.0% |
| Immigrants | Guyana | 0.0 /100 | #310 | Tragic 81.0% |
| Natives/Alaskans | 0.0 /100 | #311 | Tragic 80.9% |
| Nicaraguans | 0.0 /100 | #312 | Tragic 80.9% |
| Cape Verdeans | 0.0 /100 | #313 | Tragic 80.9% |
| Belizeans | 0.0 /100 | #314 | Tragic 80.9% |
| Apache | 0.0 /100 | #315 | Tragic 80.7% |
| Central American Indians | 0.0 /100 | #316 | Tragic 80.6% |
| Immigrants | Caribbean | 0.0 /100 | #317 | Tragic 80.5% |