Immigrants from Sierra Leone vs Immigrants from Chile GED/Equivalency
COMPARE
Immigrants from Sierra Leone
Immigrants from Chile
GED/Equivalency
GED/Equivalency Comparison
Immigrants from Sierra Leone
Immigrants from Chile
85.4%
GED/EQUIVALENCY
29.0/ 100
METRIC RATING
188th/ 347
METRIC RANK
85.9%
GED/EQUIVALENCY
57.3/ 100
METRIC RATING
171st/ 347
METRIC RANK
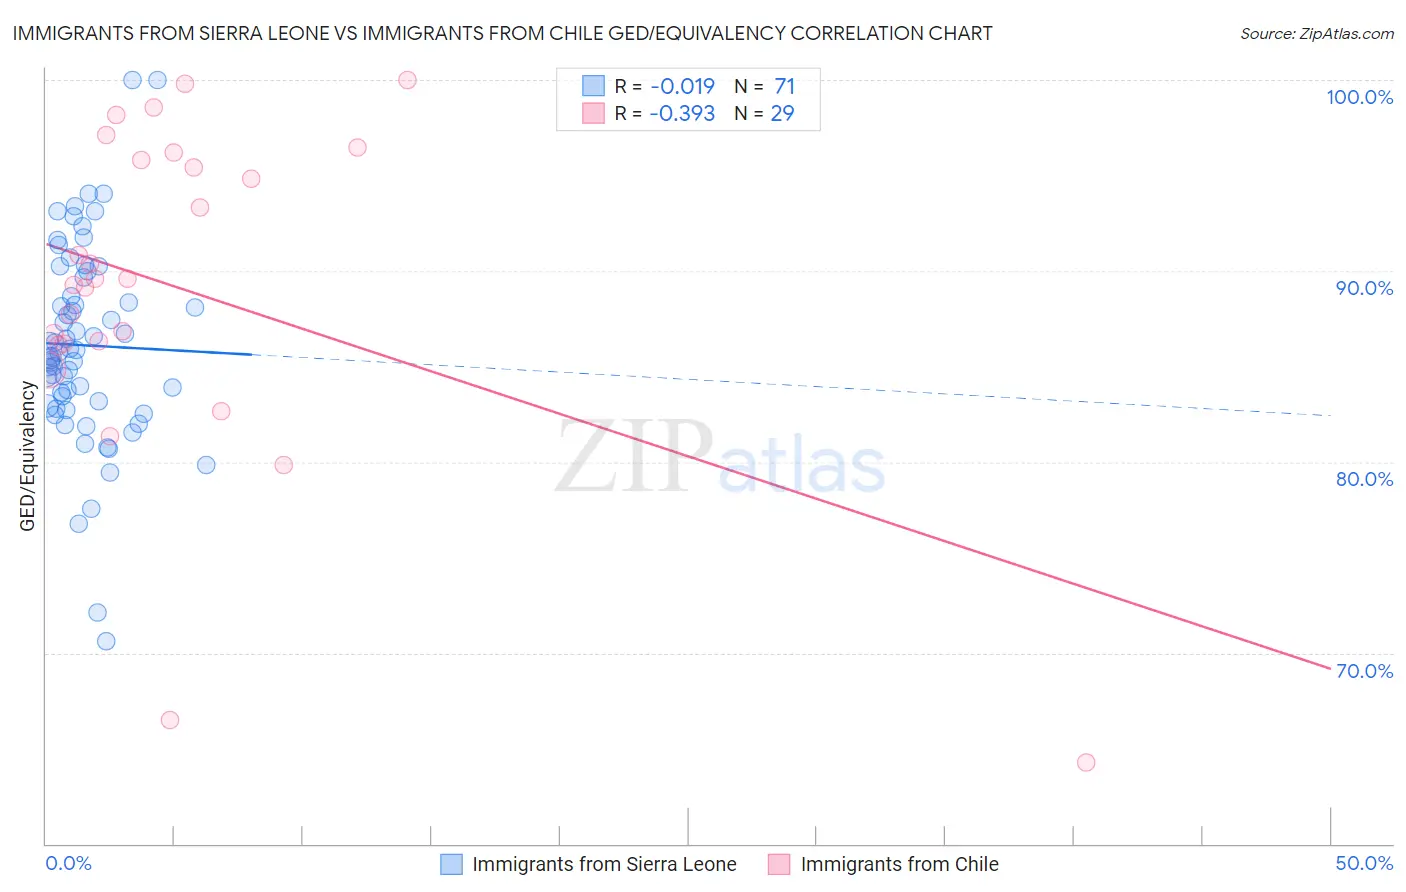
Immigrants from Sierra Leone vs Immigrants from Chile GED/Equivalency Correlation Chart
The statistical analysis conducted on geographies consisting of 101,654,421 people shows no correlation between the proportion of Immigrants from Sierra Leone and percentage of population with at least ged/equivalency education in the United States with a correlation coefficient (R) of -0.019 and weighted average of 85.4%. Similarly, the statistical analysis conducted on geographies consisting of 218,647,266 people shows a mild negative correlation between the proportion of Immigrants from Chile and percentage of population with at least ged/equivalency education in the United States with a correlation coefficient (R) of -0.393 and weighted average of 85.9%, a difference of 0.61%.
GED/Equivalency Correlation Summary
| Measurement | Immigrants from Sierra Leone | Immigrants from Chile |
| Minimum | 70.6% | 64.3% |
| Maximum | 100.0% | 100.0% |
| Range | 29.4% | 35.7% |
| Mean | 86.1% | 89.1% |
| Median | 85.7% | 89.6% |
| Interquartile 25% (IQ1) | 82.9% | 86.1% |
| Interquartile 75% (IQ3) | 89.6% | 96.0% |
| Interquartile Range (IQR) | 6.7% | 9.8% |
| Standard Deviation (Sample) | 5.2% | 8.6% |
| Standard Deviation (Population) | 5.2% | 8.5% |
Demographics Similar to Immigrants from Sierra Leone and Immigrants from Chile by GED/Equivalency
In terms of ged/equivalency, the demographic groups most similar to Immigrants from Sierra Leone are Guamanian/Chamorro (85.3%, a difference of 0.010%), Immigrants from Afghanistan (85.4%, a difference of 0.020%), Spaniard (85.4%, a difference of 0.070%), Spanish (85.4%, a difference of 0.090%), and Immigrants from Oceania (85.5%, a difference of 0.11%). Similarly, the demographic groups most similar to Immigrants from Chile are Afghan (85.9%, a difference of 0.050%), Bermudan (85.8%, a difference of 0.050%), Immigrants from Ethiopia (86.0%, a difference of 0.080%), Immigrants from Venezuela (85.8%, a difference of 0.14%), and Ottawa (85.8%, a difference of 0.15%).
| Demographics | Rating | Rank | GED/Equivalency |
| Immigrants | Ethiopia | 61.2 /100 | #169 | Good 86.0% |
| Afghans | 59.7 /100 | #170 | Average 85.9% |
| Immigrants | Chile | 57.3 /100 | #171 | Average 85.9% |
| Bermudans | 55.1 /100 | #172 | Average 85.8% |
| Immigrants | Venezuela | 50.7 /100 | #173 | Average 85.8% |
| Ottawa | 50.0 /100 | #174 | Average 85.8% |
| Immigrants | Bolivia | 49.8 /100 | #175 | Average 85.8% |
| Immigrants | Eastern Africa | 47.7 /100 | #176 | Average 85.7% |
| Immigrants | Uganda | 45.2 /100 | #177 | Average 85.7% |
| Koreans | 41.2 /100 | #178 | Average 85.6% |
| Aleuts | 40.5 /100 | #179 | Average 85.6% |
| Immigrants | Southern Europe | 38.4 /100 | #180 | Fair 85.5% |
| Moroccans | 37.7 /100 | #181 | Fair 85.5% |
| Sudanese | 35.2 /100 | #182 | Fair 85.5% |
| Immigrants | Sudan | 34.2 /100 | #183 | Fair 85.5% |
| Immigrants | Oceania | 33.6 /100 | #184 | Fair 85.5% |
| Spanish | 32.8 /100 | #185 | Fair 85.4% |
| Spaniards | 31.9 /100 | #186 | Fair 85.4% |
| Immigrants | Afghanistan | 29.8 /100 | #187 | Fair 85.4% |
| Immigrants | Sierra Leone | 29.0 /100 | #188 | Fair 85.4% |
| Guamanians/Chamorros | 28.4 /100 | #189 | Fair 85.3% |