Immigrants from Sierra Leone vs Dominican GED/Equivalency
COMPARE
Immigrants from Sierra Leone
Dominican
GED/Equivalency
GED/Equivalency Comparison
Immigrants from Sierra Leone
Dominicans
85.4%
GED/EQUIVALENCY
29.0/ 100
METRIC RATING
188th/ 347
METRIC RANK
79.1%
GED/EQUIVALENCY
0.0/ 100
METRIC RATING
329th/ 347
METRIC RANK
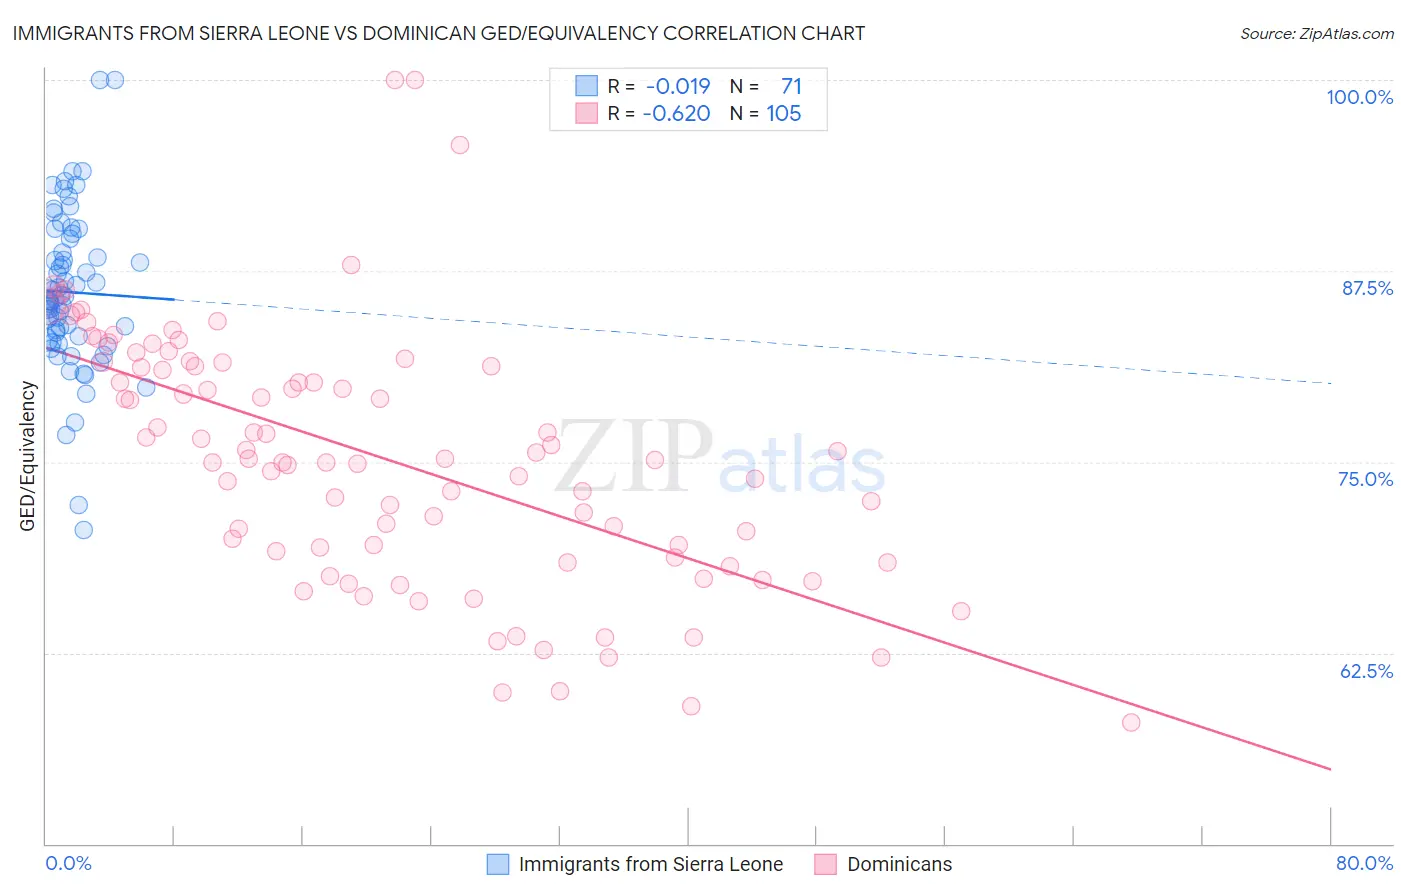
Immigrants from Sierra Leone vs Dominican GED/Equivalency Correlation Chart
The statistical analysis conducted on geographies consisting of 101,654,421 people shows no correlation between the proportion of Immigrants from Sierra Leone and percentage of population with at least ged/equivalency education in the United States with a correlation coefficient (R) of -0.019 and weighted average of 85.4%. Similarly, the statistical analysis conducted on geographies consisting of 355,143,187 people shows a significant negative correlation between the proportion of Dominicans and percentage of population with at least ged/equivalency education in the United States with a correlation coefficient (R) of -0.620 and weighted average of 79.1%, a difference of 8.0%.
GED/Equivalency Correlation Summary
| Measurement | Immigrants from Sierra Leone | Dominican |
| Minimum | 70.6% | 58.0% |
| Maximum | 100.0% | 100.0% |
| Range | 29.4% | 42.0% |
| Mean | 86.1% | 75.3% |
| Median | 85.7% | 75.2% |
| Interquartile 25% (IQ1) | 82.9% | 69.0% |
| Interquartile 75% (IQ3) | 89.6% | 81.4% |
| Interquartile Range (IQR) | 6.7% | 12.5% |
| Standard Deviation (Sample) | 5.2% | 8.3% |
| Standard Deviation (Population) | 5.2% | 8.3% |
Similar Demographics by GED/Equivalency
Demographics Similar to Immigrants from Sierra Leone by GED/Equivalency
In terms of ged/equivalency, the demographic groups most similar to Immigrants from Sierra Leone are Guamanian/Chamorro (85.3%, a difference of 0.010%), Immigrants from Afghanistan (85.4%, a difference of 0.020%), Alaskan Athabascan (85.3%, a difference of 0.040%), Spaniard (85.4%, a difference of 0.070%), and Spanish (85.4%, a difference of 0.090%).
| Demographics | Rating | Rank | GED/Equivalency |
| Moroccans | 37.7 /100 | #181 | Fair 85.5% |
| Sudanese | 35.2 /100 | #182 | Fair 85.5% |
| Immigrants | Sudan | 34.2 /100 | #183 | Fair 85.5% |
| Immigrants | Oceania | 33.6 /100 | #184 | Fair 85.5% |
| Spanish | 32.8 /100 | #185 | Fair 85.4% |
| Spaniards | 31.9 /100 | #186 | Fair 85.4% |
| Immigrants | Afghanistan | 29.8 /100 | #187 | Fair 85.4% |
| Immigrants | Sierra Leone | 29.0 /100 | #188 | Fair 85.4% |
| Guamanians/Chamorros | 28.4 /100 | #189 | Fair 85.3% |
| Alaskan Athabascans | 27.5 /100 | #190 | Fair 85.3% |
| South American Indians | 22.8 /100 | #191 | Fair 85.2% |
| Immigrants | Nonimmigrants | 22.7 /100 | #192 | Fair 85.2% |
| Delaware | 22.2 /100 | #193 | Fair 85.2% |
| Puget Sound Salish | 20.8 /100 | #194 | Fair 85.2% |
| Chippewa | 20.8 /100 | #195 | Fair 85.2% |
Demographics Similar to Dominicans by GED/Equivalency
In terms of ged/equivalency, the demographic groups most similar to Dominicans are Hispanic or Latino (79.1%, a difference of 0.050%), Central American (79.2%, a difference of 0.15%), Immigrants from Cabo Verde (78.9%, a difference of 0.16%), Yuman (79.2%, a difference of 0.17%), and Honduran (79.3%, a difference of 0.27%).
| Demographics | Rating | Rank | GED/Equivalency |
| Lumbee | 0.0 /100 | #322 | Tragic 80.0% |
| Immigrants | Nicaragua | 0.0 /100 | #323 | Tragic 79.9% |
| Mexican American Indians | 0.0 /100 | #324 | Tragic 79.4% |
| Hondurans | 0.0 /100 | #325 | Tragic 79.3% |
| Yuman | 0.0 /100 | #326 | Tragic 79.2% |
| Central Americans | 0.0 /100 | #327 | Tragic 79.2% |
| Hispanics or Latinos | 0.0 /100 | #328 | Tragic 79.1% |
| Dominicans | 0.0 /100 | #329 | Tragic 79.1% |
| Immigrants | Cabo Verde | 0.0 /100 | #330 | Tragic 78.9% |
| Immigrants | Honduras | 0.0 /100 | #331 | Tragic 78.7% |
| Immigrants | Azores | 0.0 /100 | #332 | Tragic 78.7% |
| Salvadorans | 0.0 /100 | #333 | Tragic 78.6% |
| Guatemalans | 0.0 /100 | #334 | Tragic 78.5% |
| Immigrants | Latin America | 0.0 /100 | #335 | Tragic 78.5% |
| Immigrants | Dominican Republic | 0.0 /100 | #336 | Tragic 78.0% |