Apache vs Immigrants from Kenya GED/Equivalency
COMPARE
Apache
Immigrants from Kenya
GED/Equivalency
GED/Equivalency Comparison
Apache
Immigrants from Kenya
80.7%
GED/EQUIVALENCY
0.0/ 100
METRIC RATING
315th/ 347
METRIC RANK
86.2%
GED/EQUIVALENCY
71.8/ 100
METRIC RATING
159th/ 347
METRIC RANK
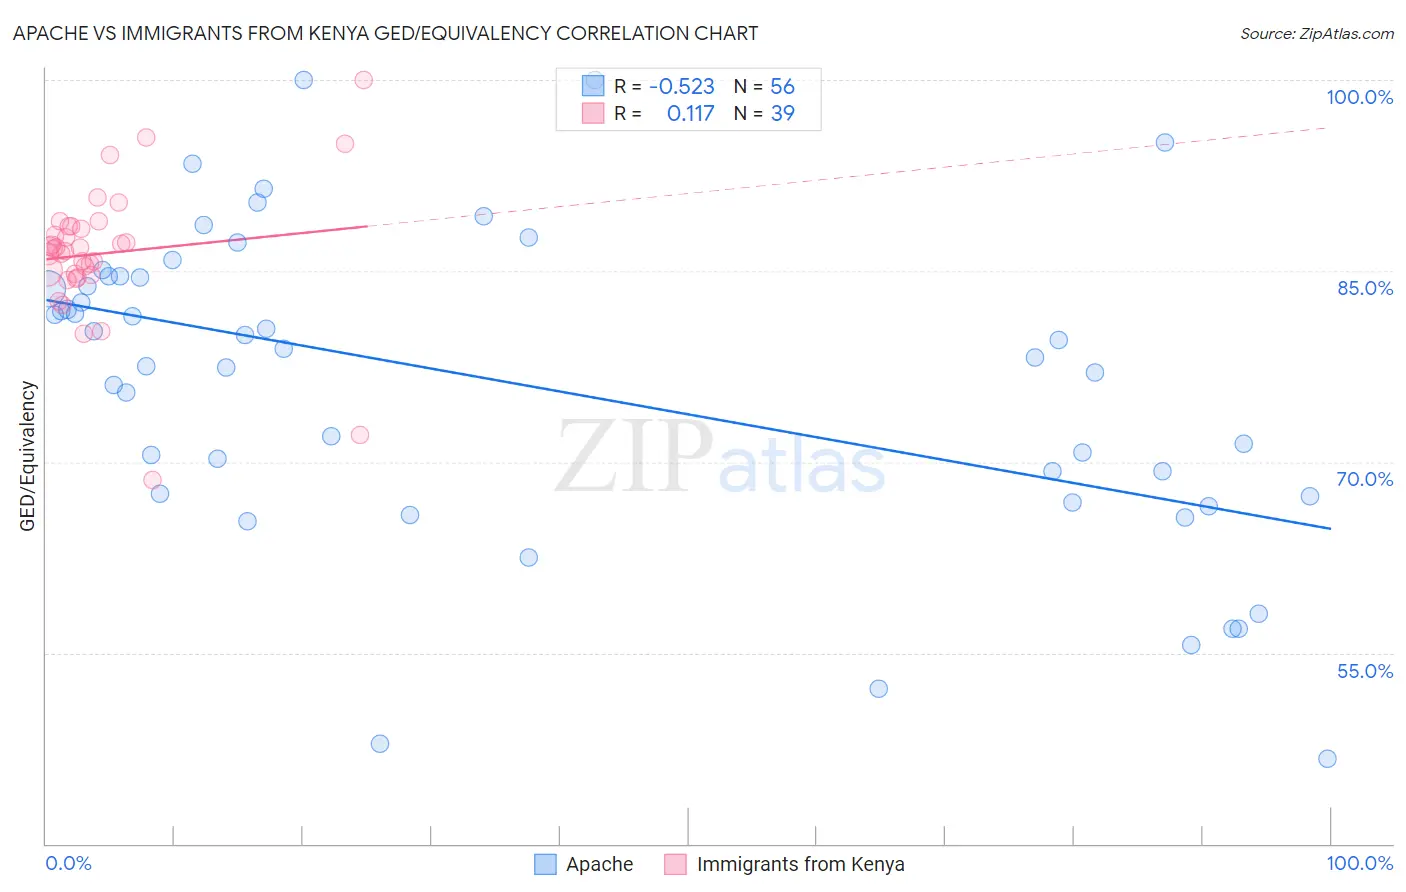
Apache vs Immigrants from Kenya GED/Equivalency Correlation Chart
The statistical analysis conducted on geographies consisting of 231,143,029 people shows a substantial negative correlation between the proportion of Apache and percentage of population with at least ged/equivalency education in the United States with a correlation coefficient (R) of -0.523 and weighted average of 80.7%. Similarly, the statistical analysis conducted on geographies consisting of 218,076,690 people shows a poor positive correlation between the proportion of Immigrants from Kenya and percentage of population with at least ged/equivalency education in the United States with a correlation coefficient (R) of 0.117 and weighted average of 86.2%, a difference of 6.8%.
GED/Equivalency Correlation Summary
| Measurement | Apache | Immigrants from Kenya |
| Minimum | 46.7% | 68.6% |
| Maximum | 100.0% | 100.0% |
| Range | 53.3% | 31.4% |
| Mean | 76.1% | 86.4% |
| Median | 78.5% | 86.8% |
| Interquartile 25% (IQ1) | 67.4% | 84.7% |
| Interquartile 75% (IQ3) | 84.5% | 88.5% |
| Interquartile Range (IQR) | 17.1% | 3.8% |
| Standard Deviation (Sample) | 12.4% | 5.4% |
| Standard Deviation (Population) | 12.2% | 5.4% |
Similar Demographics by GED/Equivalency
Demographics Similar to Apache by GED/Equivalency
In terms of ged/equivalency, the demographic groups most similar to Apache are Central American Indian (80.6%, a difference of 0.13%), Immigrants from Caribbean (80.5%, a difference of 0.24%), Belizean (80.9%, a difference of 0.25%), Yaqui (80.5%, a difference of 0.26%), and Immigrants from Belize (80.5%, a difference of 0.26%).
| Demographics | Rating | Rank | GED/Equivalency |
| Puerto Ricans | 0.0 /100 | #308 | Tragic 81.1% |
| Immigrants | Ecuador | 0.0 /100 | #309 | Tragic 81.0% |
| Immigrants | Guyana | 0.0 /100 | #310 | Tragic 81.0% |
| Natives/Alaskans | 0.0 /100 | #311 | Tragic 80.9% |
| Nicaraguans | 0.0 /100 | #312 | Tragic 80.9% |
| Cape Verdeans | 0.0 /100 | #313 | Tragic 80.9% |
| Belizeans | 0.0 /100 | #314 | Tragic 80.9% |
| Apache | 0.0 /100 | #315 | Tragic 80.7% |
| Central American Indians | 0.0 /100 | #316 | Tragic 80.6% |
| Immigrants | Caribbean | 0.0 /100 | #317 | Tragic 80.5% |
| Yaqui | 0.0 /100 | #318 | Tragic 80.5% |
| Immigrants | Belize | 0.0 /100 | #319 | Tragic 80.5% |
| Immigrants | Cuba | 0.0 /100 | #320 | Tragic 80.2% |
| Yup'ik | 0.0 /100 | #321 | Tragic 80.0% |
| Lumbee | 0.0 /100 | #322 | Tragic 80.0% |
Demographics Similar to Immigrants from Kenya by GED/Equivalency
In terms of ged/equivalency, the demographic groups most similar to Immigrants from Kenya are White/Caucasian (86.2%, a difference of 0.010%), German Russian (86.2%, a difference of 0.010%), Immigrants from Nepal (86.2%, a difference of 0.040%), Immigrants from Morocco (86.1%, a difference of 0.060%), and Immigrants from Syria (86.1%, a difference of 0.060%).
| Demographics | Rating | Rank | GED/Equivalency |
| Brazilians | 77.2 /100 | #152 | Good 86.3% |
| Kenyans | 76.6 /100 | #153 | Good 86.3% |
| Armenians | 76.4 /100 | #154 | Good 86.3% |
| Iraqis | 75.2 /100 | #155 | Good 86.2% |
| Immigrants | Nepal | 73.3 /100 | #156 | Good 86.2% |
| Whites/Caucasians | 72.2 /100 | #157 | Good 86.2% |
| German Russians | 72.1 /100 | #158 | Good 86.2% |
| Immigrants | Kenya | 71.8 /100 | #159 | Good 86.2% |
| Immigrants | Morocco | 69.5 /100 | #160 | Good 86.1% |
| Immigrants | Syria | 69.3 /100 | #161 | Good 86.1% |
| Immigrants | Iraq | 68.1 /100 | #162 | Good 86.1% |
| Ugandans | 66.3 /100 | #163 | Good 86.1% |
| Venezuelans | 65.5 /100 | #164 | Good 86.0% |
| Alsatians | 64.3 /100 | #165 | Good 86.0% |
| Immigrants | Albania | 64.2 /100 | #166 | Good 86.0% |