Immigrants from Sierra Leone vs Eastern European GED/Equivalency
COMPARE
Immigrants from Sierra Leone
Eastern European
GED/Equivalency
GED/Equivalency Comparison
Immigrants from Sierra Leone
Eastern Europeans
85.4%
GED/EQUIVALENCY
29.0/ 100
METRIC RATING
188th/ 347
METRIC RANK
89.1%
GED/EQUIVALENCY
99.9/ 100
METRIC RATING
7th/ 347
METRIC RANK
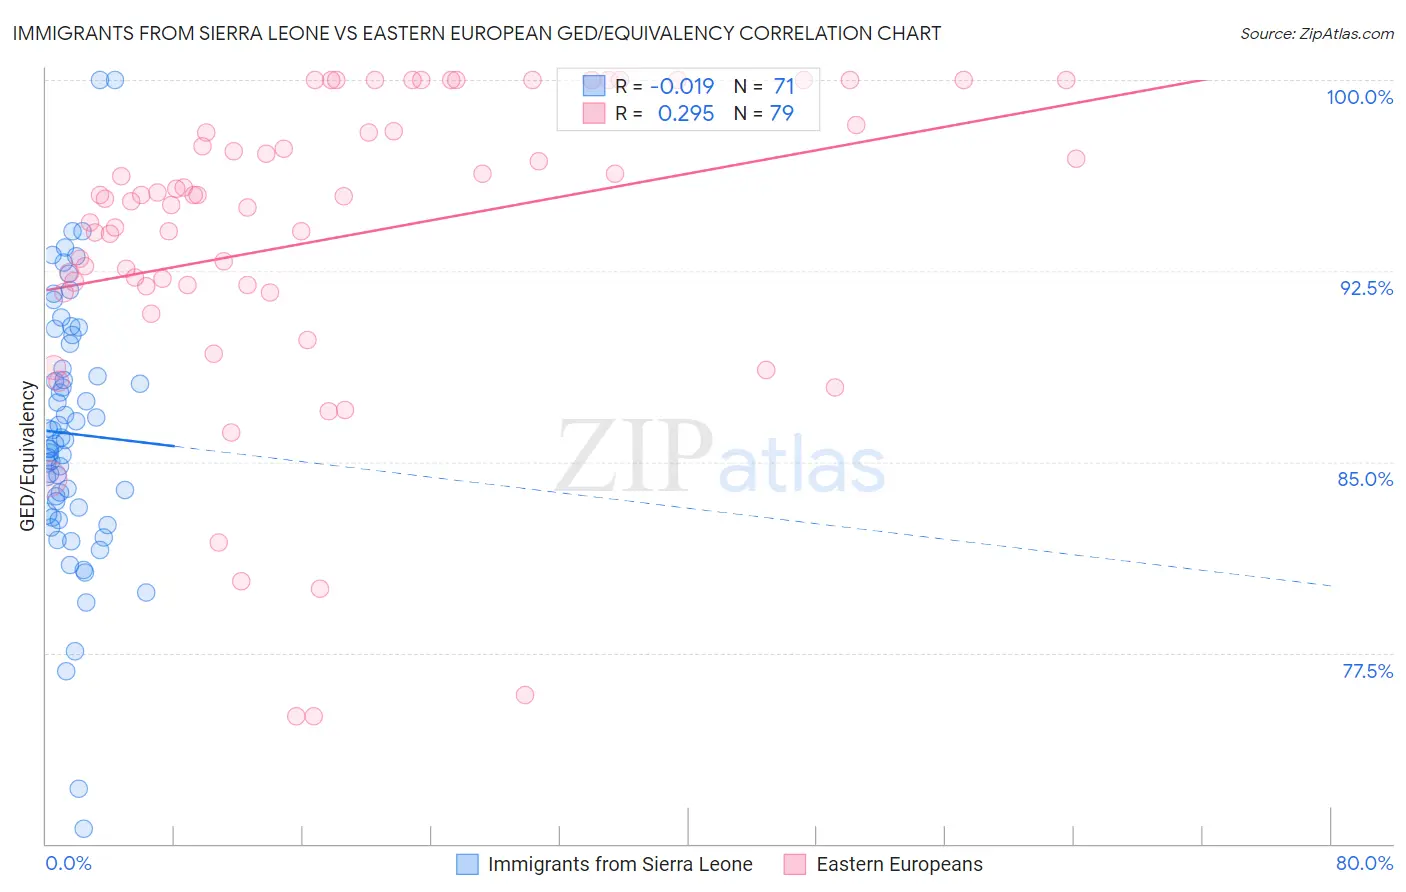
Immigrants from Sierra Leone vs Eastern European GED/Equivalency Correlation Chart
The statistical analysis conducted on geographies consisting of 101,654,421 people shows no correlation between the proportion of Immigrants from Sierra Leone and percentage of population with at least ged/equivalency education in the United States with a correlation coefficient (R) of -0.019 and weighted average of 85.4%. Similarly, the statistical analysis conducted on geographies consisting of 461,247,198 people shows a weak positive correlation between the proportion of Eastern Europeans and percentage of population with at least ged/equivalency education in the United States with a correlation coefficient (R) of 0.295 and weighted average of 89.1%, a difference of 4.4%.
GED/Equivalency Correlation Summary
| Measurement | Immigrants from Sierra Leone | Eastern European |
| Minimum | 70.6% | 75.0% |
| Maximum | 100.0% | 100.0% |
| Range | 29.4% | 25.0% |
| Mean | 86.1% | 93.8% |
| Median | 85.7% | 95.3% |
| Interquartile 25% (IQ1) | 82.9% | 91.9% |
| Interquartile 75% (IQ3) | 89.6% | 98.0% |
| Interquartile Range (IQR) | 6.7% | 6.1% |
| Standard Deviation (Sample) | 5.2% | 6.1% |
| Standard Deviation (Population) | 5.2% | 6.0% |
Similar Demographics by GED/Equivalency
Demographics Similar to Immigrants from Sierra Leone by GED/Equivalency
In terms of ged/equivalency, the demographic groups most similar to Immigrants from Sierra Leone are Guamanian/Chamorro (85.3%, a difference of 0.010%), Immigrants from Afghanistan (85.4%, a difference of 0.020%), Alaskan Athabascan (85.3%, a difference of 0.040%), Spaniard (85.4%, a difference of 0.070%), and Spanish (85.4%, a difference of 0.090%).
| Demographics | Rating | Rank | GED/Equivalency |
| Moroccans | 37.7 /100 | #181 | Fair 85.5% |
| Sudanese | 35.2 /100 | #182 | Fair 85.5% |
| Immigrants | Sudan | 34.2 /100 | #183 | Fair 85.5% |
| Immigrants | Oceania | 33.6 /100 | #184 | Fair 85.5% |
| Spanish | 32.8 /100 | #185 | Fair 85.4% |
| Spaniards | 31.9 /100 | #186 | Fair 85.4% |
| Immigrants | Afghanistan | 29.8 /100 | #187 | Fair 85.4% |
| Immigrants | Sierra Leone | 29.0 /100 | #188 | Fair 85.4% |
| Guamanians/Chamorros | 28.4 /100 | #189 | Fair 85.3% |
| Alaskan Athabascans | 27.5 /100 | #190 | Fair 85.3% |
| South American Indians | 22.8 /100 | #191 | Fair 85.2% |
| Immigrants | Nonimmigrants | 22.7 /100 | #192 | Fair 85.2% |
| Delaware | 22.2 /100 | #193 | Fair 85.2% |
| Puget Sound Salish | 20.8 /100 | #194 | Fair 85.2% |
| Chippewa | 20.8 /100 | #195 | Fair 85.2% |
Demographics Similar to Eastern Europeans by GED/Equivalency
In terms of ged/equivalency, the demographic groups most similar to Eastern Europeans are Thai (89.1%, a difference of 0.040%), Carpatho Rusyn (89.1%, a difference of 0.050%), Latvian (89.2%, a difference of 0.060%), Chinese (89.0%, a difference of 0.070%), and Norwegian (89.0%, a difference of 0.12%).
| Demographics | Rating | Rank | GED/Equivalency |
| Immigrants | India | 100.0 /100 | #1 | Exceptional 89.7% |
| Filipinos | 100.0 /100 | #2 | Exceptional 89.5% |
| Immigrants | Singapore | 100.0 /100 | #3 | Exceptional 89.3% |
| Iranians | 100.0 /100 | #4 | Exceptional 89.2% |
| Latvians | 100.0 /100 | #5 | Exceptional 89.2% |
| Thais | 100.0 /100 | #6 | Exceptional 89.1% |
| Eastern Europeans | 99.9 /100 | #7 | Exceptional 89.1% |
| Carpatho Rusyns | 99.9 /100 | #8 | Exceptional 89.1% |
| Chinese | 99.9 /100 | #9 | Exceptional 89.0% |
| Norwegians | 99.9 /100 | #10 | Exceptional 89.0% |
| Bulgarians | 99.9 /100 | #11 | Exceptional 89.0% |
| Lithuanians | 99.9 /100 | #12 | Exceptional 88.9% |
| Immigrants | Iran | 99.9 /100 | #13 | Exceptional 88.9% |
| Cypriots | 99.9 /100 | #14 | Exceptional 88.9% |
| Okinawans | 99.9 /100 | #15 | Exceptional 88.9% |