Immigrants from India vs Immigrants from Kenya GED/Equivalency
COMPARE
Immigrants from India
Immigrants from Kenya
GED/Equivalency
GED/Equivalency Comparison
Immigrants from India
Immigrants from Kenya
89.7%
GED/EQUIVALENCY
100.0/ 100
METRIC RATING
1st/ 347
METRIC RANK
86.2%
GED/EQUIVALENCY
71.8/ 100
METRIC RATING
159th/ 347
METRIC RANK
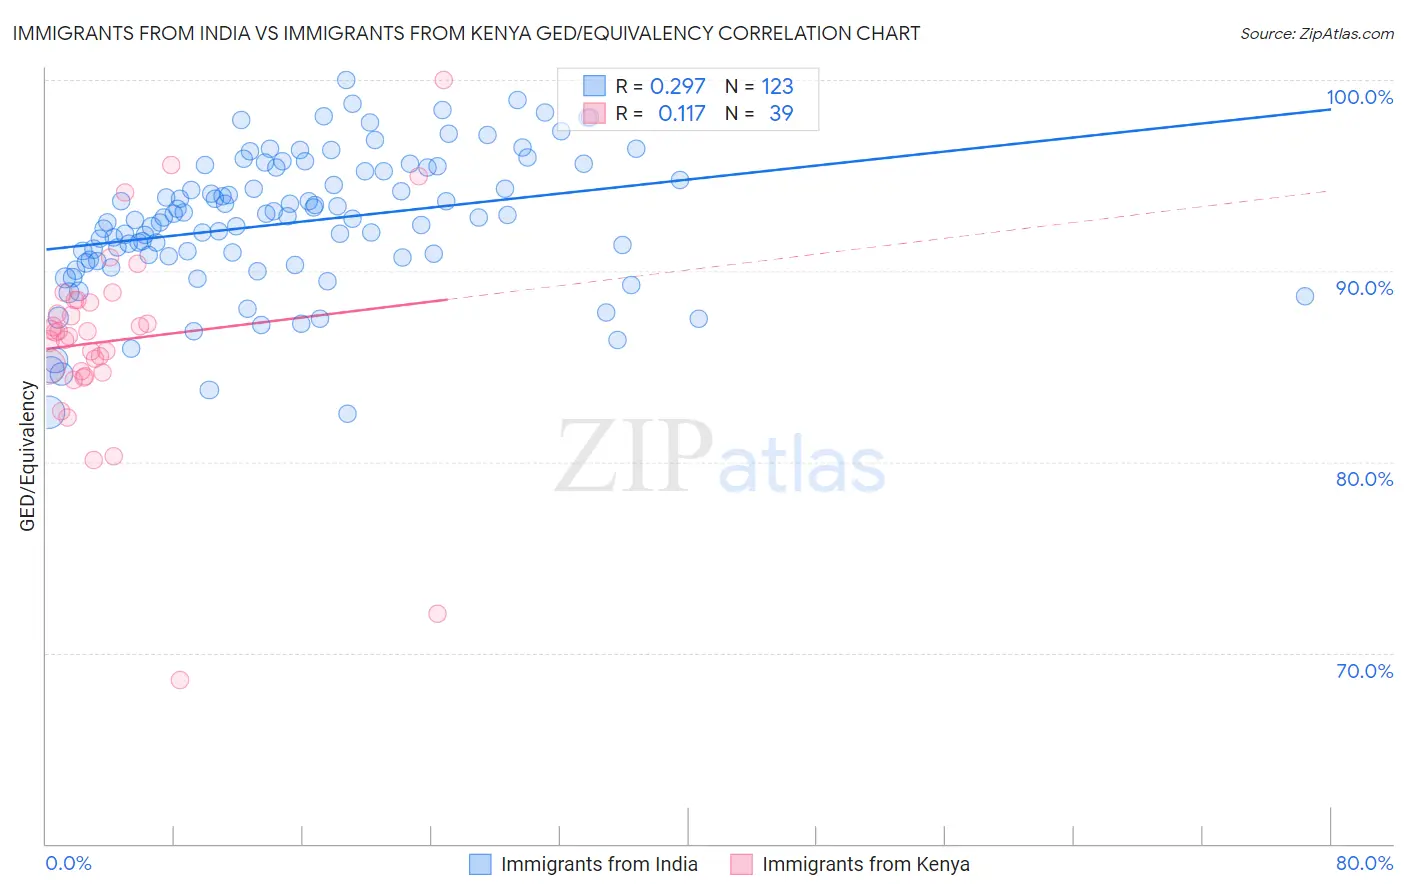
Immigrants from India vs Immigrants from Kenya GED/Equivalency Correlation Chart
The statistical analysis conducted on geographies consisting of 434,105,844 people shows a weak positive correlation between the proportion of Immigrants from India and percentage of population with at least ged/equivalency education in the United States with a correlation coefficient (R) of 0.297 and weighted average of 89.7%. Similarly, the statistical analysis conducted on geographies consisting of 218,076,690 people shows a poor positive correlation between the proportion of Immigrants from Kenya and percentage of population with at least ged/equivalency education in the United States with a correlation coefficient (R) of 0.117 and weighted average of 86.2%, a difference of 4.2%.
GED/Equivalency Correlation Summary
| Measurement | Immigrants from India | Immigrants from Kenya |
| Minimum | 82.6% | 68.6% |
| Maximum | 100.0% | 100.0% |
| Range | 17.4% | 31.4% |
| Mean | 92.5% | 86.4% |
| Median | 92.8% | 86.8% |
| Interquartile 25% (IQ1) | 90.6% | 84.7% |
| Interquartile 75% (IQ3) | 95.4% | 88.5% |
| Interquartile Range (IQR) | 4.8% | 3.8% |
| Standard Deviation (Sample) | 3.6% | 5.4% |
| Standard Deviation (Population) | 3.6% | 5.4% |
Similar Demographics by GED/Equivalency
Demographics Similar to Immigrants from India by GED/Equivalency
In terms of ged/equivalency, the demographic groups most similar to Immigrants from India are Filipino (89.5%, a difference of 0.26%), Immigrants from Singapore (89.3%, a difference of 0.47%), Iranian (89.2%, a difference of 0.56%), Latvian (89.2%, a difference of 0.66%), and Thai (89.1%, a difference of 0.68%).
| Demographics | Rating | Rank | GED/Equivalency |
| Immigrants | India | 100.0 /100 | #1 | Exceptional 89.7% |
| Filipinos | 100.0 /100 | #2 | Exceptional 89.5% |
| Immigrants | Singapore | 100.0 /100 | #3 | Exceptional 89.3% |
| Iranians | 100.0 /100 | #4 | Exceptional 89.2% |
| Latvians | 100.0 /100 | #5 | Exceptional 89.2% |
| Thais | 100.0 /100 | #6 | Exceptional 89.1% |
| Eastern Europeans | 99.9 /100 | #7 | Exceptional 89.1% |
| Carpatho Rusyns | 99.9 /100 | #8 | Exceptional 89.1% |
| Chinese | 99.9 /100 | #9 | Exceptional 89.0% |
| Norwegians | 99.9 /100 | #10 | Exceptional 89.0% |
| Bulgarians | 99.9 /100 | #11 | Exceptional 89.0% |
| Lithuanians | 99.9 /100 | #12 | Exceptional 88.9% |
| Immigrants | Iran | 99.9 /100 | #13 | Exceptional 88.9% |
| Cypriots | 99.9 /100 | #14 | Exceptional 88.9% |
| Okinawans | 99.9 /100 | #15 | Exceptional 88.9% |
Demographics Similar to Immigrants from Kenya by GED/Equivalency
In terms of ged/equivalency, the demographic groups most similar to Immigrants from Kenya are White/Caucasian (86.2%, a difference of 0.010%), German Russian (86.2%, a difference of 0.010%), Immigrants from Nepal (86.2%, a difference of 0.040%), Immigrants from Morocco (86.1%, a difference of 0.060%), and Immigrants from Syria (86.1%, a difference of 0.060%).
| Demographics | Rating | Rank | GED/Equivalency |
| Brazilians | 77.2 /100 | #152 | Good 86.3% |
| Kenyans | 76.6 /100 | #153 | Good 86.3% |
| Armenians | 76.4 /100 | #154 | Good 86.3% |
| Iraqis | 75.2 /100 | #155 | Good 86.2% |
| Immigrants | Nepal | 73.3 /100 | #156 | Good 86.2% |
| Whites/Caucasians | 72.2 /100 | #157 | Good 86.2% |
| German Russians | 72.1 /100 | #158 | Good 86.2% |
| Immigrants | Kenya | 71.8 /100 | #159 | Good 86.2% |
| Immigrants | Morocco | 69.5 /100 | #160 | Good 86.1% |
| Immigrants | Syria | 69.3 /100 | #161 | Good 86.1% |
| Immigrants | Iraq | 68.1 /100 | #162 | Good 86.1% |
| Ugandans | 66.3 /100 | #163 | Good 86.1% |
| Venezuelans | 65.5 /100 | #164 | Good 86.0% |
| Alsatians | 64.3 /100 | #165 | Good 86.0% |
| Immigrants | Albania | 64.2 /100 | #166 | Good 86.0% |