Immigrants from Sierra Leone vs Immigrants from Kenya Unemployment
COMPARE
Immigrants from Sierra Leone
Immigrants from Kenya
Unemployment
Unemployment Comparison
Immigrants from Sierra Leone
Immigrants from Kenya
5.8%
UNEMPLOYMENT
0.1/ 100
METRIC RATING
268th/ 347
METRIC RANK
5.1%
UNEMPLOYMENT
88.2/ 100
METRIC RATING
127th/ 347
METRIC RANK
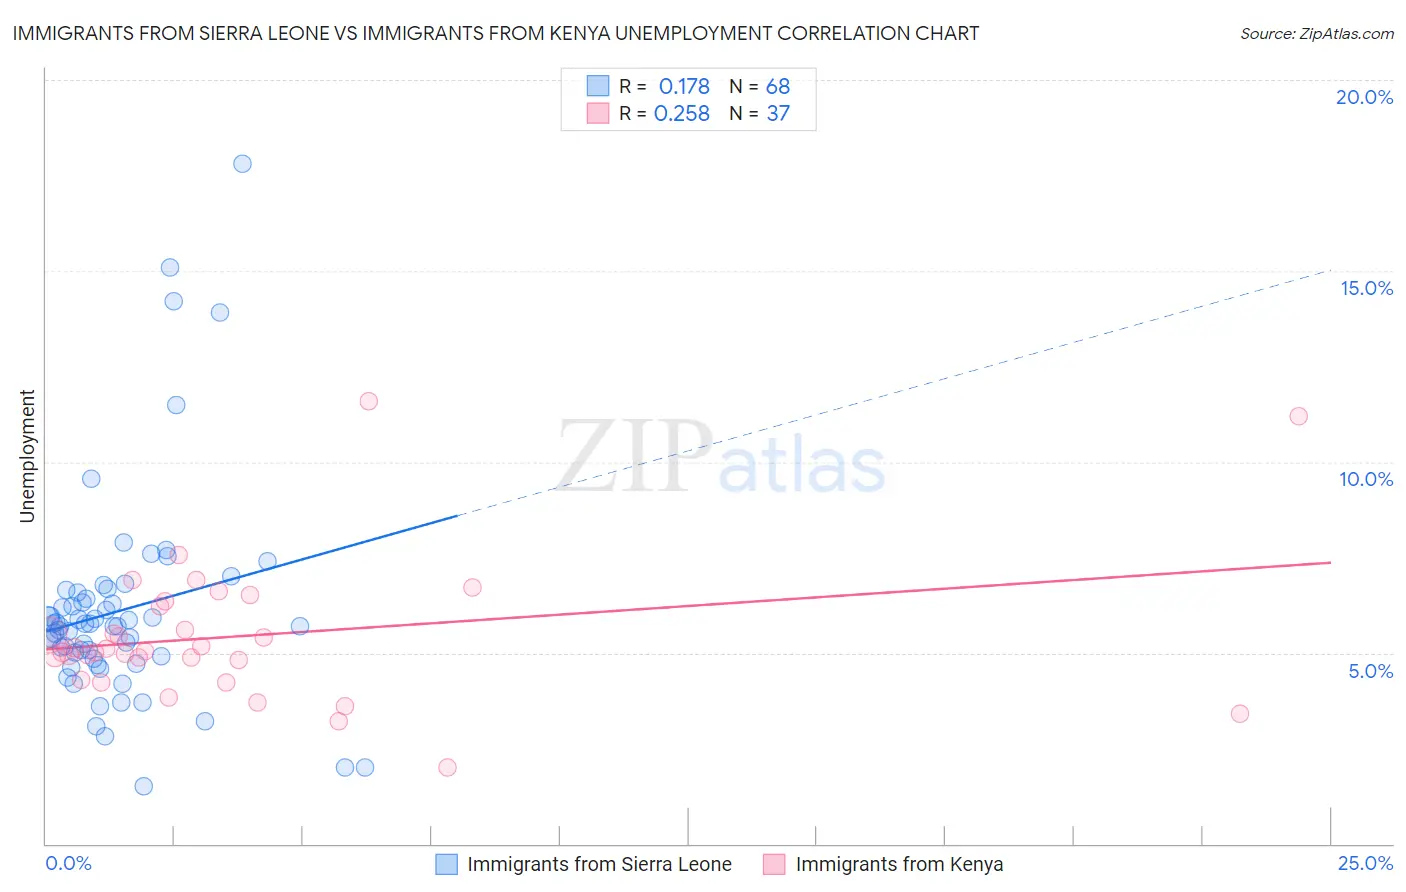
Immigrants from Sierra Leone vs Immigrants from Kenya Unemployment Correlation Chart
The statistical analysis conducted on geographies consisting of 101,634,526 people shows a poor positive correlation between the proportion of Immigrants from Sierra Leone and unemployment in the United States with a correlation coefficient (R) of 0.178 and weighted average of 5.8%. Similarly, the statistical analysis conducted on geographies consisting of 217,993,568 people shows a weak positive correlation between the proportion of Immigrants from Kenya and unemployment in the United States with a correlation coefficient (R) of 0.258 and weighted average of 5.1%, a difference of 14.6%.
Unemployment Correlation Summary
| Measurement | Immigrants from Sierra Leone | Immigrants from Kenya |
| Minimum | 1.5% | 2.0% |
| Maximum | 17.8% | 11.6% |
| Range | 16.3% | 9.6% |
| Mean | 6.1% | 5.4% |
| Median | 5.7% | 5.0% |
| Interquartile 25% (IQ1) | 4.9% | 4.5% |
| Interquartile 75% (IQ3) | 6.5% | 6.3% |
| Interquartile Range (IQR) | 1.6% | 1.7% |
| Standard Deviation (Sample) | 2.8% | 1.8% |
| Standard Deviation (Population) | 2.8% | 1.8% |
Similar Demographics by Unemployment
Demographics Similar to Immigrants from Sierra Leone by Unemployment
In terms of unemployment, the demographic groups most similar to Immigrants from Sierra Leone are Immigrants from El Salvador (5.8%, a difference of 0.010%), Immigrants from Nigeria (5.8%, a difference of 0.040%), Blackfeet (5.8%, a difference of 0.090%), Mexican American Indian (5.8%, a difference of 0.11%), and Mexican (5.9%, a difference of 0.32%).
| Demographics | Rating | Rank | Unemployment |
| Immigrants | Guatemala | 0.1 /100 | #261 | Tragic 5.8% |
| Sierra Leoneans | 0.1 /100 | #262 | Tragic 5.8% |
| Salvadorans | 0.1 /100 | #263 | Tragic 5.8% |
| Immigrants | Liberia | 0.1 /100 | #264 | Tragic 5.8% |
| Nigerians | 0.1 /100 | #265 | Tragic 5.8% |
| Mexican American Indians | 0.1 /100 | #266 | Tragic 5.8% |
| Immigrants | Nigeria | 0.1 /100 | #267 | Tragic 5.8% |
| Immigrants | Sierra Leone | 0.1 /100 | #268 | Tragic 5.8% |
| Immigrants | El Salvador | 0.1 /100 | #269 | Tragic 5.8% |
| Blackfeet | 0.1 /100 | #270 | Tragic 5.8% |
| Mexicans | 0.1 /100 | #271 | Tragic 5.9% |
| Hispanics or Latinos | 0.0 /100 | #272 | Tragic 5.9% |
| Immigrants | Fiji | 0.0 /100 | #273 | Tragic 5.9% |
| Bahamians | 0.0 /100 | #274 | Tragic 5.9% |
| Immigrants | Latin America | 0.0 /100 | #275 | Tragic 5.9% |
Demographics Similar to Immigrants from Kenya by Unemployment
In terms of unemployment, the demographic groups most similar to Immigrants from Kenya are Kenyan (5.1%, a difference of 0.0%), Immigrants from Eastern Asia (5.1%, a difference of 0.020%), Immigrants from Eastern Africa (5.1%, a difference of 0.020%), Immigrants from Latvia (5.1%, a difference of 0.020%), and Ethiopian (5.1%, a difference of 0.070%).
| Demographics | Rating | Rank | Unemployment |
| Macedonians | 89.7 /100 | #120 | Excellent 5.1% |
| Lebanese | 89.2 /100 | #121 | Excellent 5.1% |
| Immigrants | Switzerland | 89.1 /100 | #122 | Excellent 5.1% |
| Asians | 89.0 /100 | #123 | Excellent 5.1% |
| Ethiopians | 88.6 /100 | #124 | Excellent 5.1% |
| Immigrants | Eastern Asia | 88.3 /100 | #125 | Excellent 5.1% |
| Kenyans | 88.2 /100 | #126 | Excellent 5.1% |
| Immigrants | Kenya | 88.2 /100 | #127 | Excellent 5.1% |
| Immigrants | Eastern Africa | 88.1 /100 | #128 | Excellent 5.1% |
| Immigrants | Latvia | 88.0 /100 | #129 | Excellent 5.1% |
| Iranians | 86.9 /100 | #130 | Excellent 5.1% |
| Immigrants | Croatia | 86.8 /100 | #131 | Excellent 5.1% |
| Immigrants | Ethiopia | 86.7 /100 | #132 | Excellent 5.1% |
| Immigrants | Jordan | 86.6 /100 | #133 | Excellent 5.1% |
| Immigrants | Europe | 86.3 /100 | #134 | Excellent 5.1% |