Immigrants from Chile vs Yup'ik GED/Equivalency
COMPARE
Immigrants from Chile
Yup'ik
GED/Equivalency
GED/Equivalency Comparison
Immigrants from Chile
Yup'ik
85.9%
GED/EQUIVALENCY
57.3/ 100
METRIC RATING
171st/ 347
METRIC RANK
80.0%
GED/EQUIVALENCY
0.0/ 100
METRIC RATING
321st/ 347
METRIC RANK
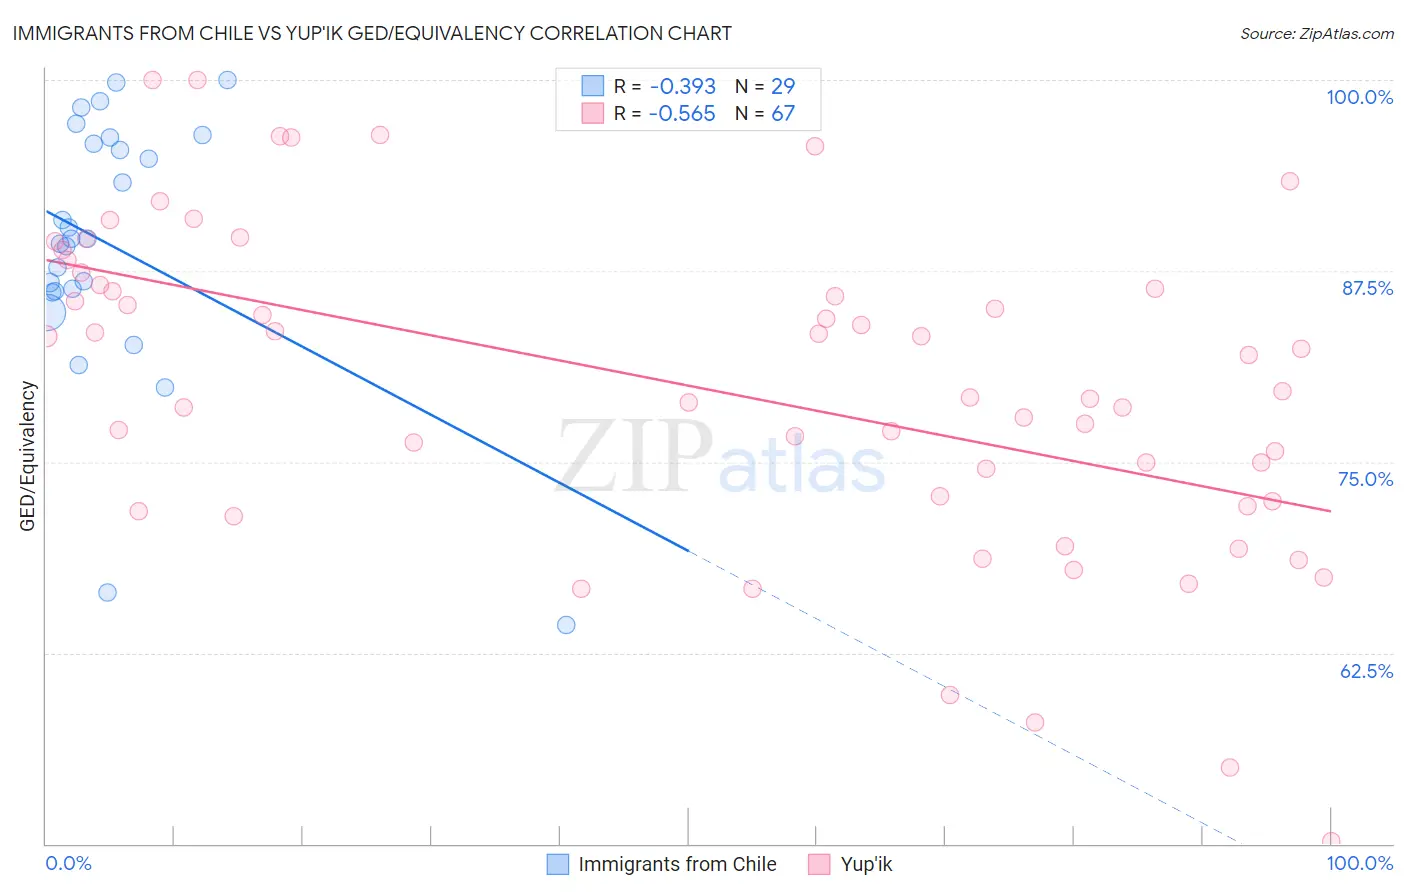
Immigrants from Chile vs Yup'ik GED/Equivalency Correlation Chart
The statistical analysis conducted on geographies consisting of 218,647,266 people shows a mild negative correlation between the proportion of Immigrants from Chile and percentage of population with at least ged/equivalency education in the United States with a correlation coefficient (R) of -0.393 and weighted average of 85.9%. Similarly, the statistical analysis conducted on geographies consisting of 39,962,947 people shows a substantial negative correlation between the proportion of Yup'ik and percentage of population with at least ged/equivalency education in the United States with a correlation coefficient (R) of -0.565 and weighted average of 80.0%, a difference of 7.3%.
GED/Equivalency Correlation Summary
| Measurement | Immigrants from Chile | Yup'ik |
| Minimum | 64.3% | 50.2% |
| Maximum | 100.0% | 100.0% |
| Range | 35.7% | 49.8% |
| Mean | 89.1% | 79.9% |
| Median | 89.6% | 79.6% |
| Interquartile 25% (IQ1) | 86.1% | 72.4% |
| Interquartile 75% (IQ3) | 96.0% | 86.6% |
| Interquartile Range (IQR) | 9.8% | 14.2% |
| Standard Deviation (Sample) | 8.6% | 10.6% |
| Standard Deviation (Population) | 8.5% | 10.5% |
Similar Demographics by GED/Equivalency
Demographics Similar to Immigrants from Chile by GED/Equivalency
In terms of ged/equivalency, the demographic groups most similar to Immigrants from Chile are Afghan (85.9%, a difference of 0.050%), Bermudan (85.8%, a difference of 0.050%), Immigrants from Ethiopia (86.0%, a difference of 0.080%), Sierra Leonean (86.0%, a difference of 0.10%), and Ethiopian (86.0%, a difference of 0.14%).
| Demographics | Rating | Rank | GED/Equivalency |
| Venezuelans | 65.5 /100 | #164 | Good 86.0% |
| Alsatians | 64.3 /100 | #165 | Good 86.0% |
| Immigrants | Albania | 64.2 /100 | #166 | Good 86.0% |
| Ethiopians | 63.7 /100 | #167 | Good 86.0% |
| Sierra Leoneans | 61.8 /100 | #168 | Good 86.0% |
| Immigrants | Ethiopia | 61.2 /100 | #169 | Good 86.0% |
| Afghans | 59.7 /100 | #170 | Average 85.9% |
| Immigrants | Chile | 57.3 /100 | #171 | Average 85.9% |
| Bermudans | 55.1 /100 | #172 | Average 85.8% |
| Immigrants | Venezuela | 50.7 /100 | #173 | Average 85.8% |
| Ottawa | 50.0 /100 | #174 | Average 85.8% |
| Immigrants | Bolivia | 49.8 /100 | #175 | Average 85.8% |
| Immigrants | Eastern Africa | 47.7 /100 | #176 | Average 85.7% |
| Immigrants | Uganda | 45.2 /100 | #177 | Average 85.7% |
| Koreans | 41.2 /100 | #178 | Average 85.6% |
Demographics Similar to Yup'ik by GED/Equivalency
In terms of ged/equivalency, the demographic groups most similar to Yup'ik are Lumbee (80.0%, a difference of 0.070%), Immigrants from Cuba (80.2%, a difference of 0.17%), Immigrants from Nicaragua (79.9%, a difference of 0.19%), Yaqui (80.5%, a difference of 0.58%), and Immigrants from Belize (80.5%, a difference of 0.58%).
| Demographics | Rating | Rank | GED/Equivalency |
| Belizeans | 0.0 /100 | #314 | Tragic 80.9% |
| Apache | 0.0 /100 | #315 | Tragic 80.7% |
| Central American Indians | 0.0 /100 | #316 | Tragic 80.6% |
| Immigrants | Caribbean | 0.0 /100 | #317 | Tragic 80.5% |
| Yaqui | 0.0 /100 | #318 | Tragic 80.5% |
| Immigrants | Belize | 0.0 /100 | #319 | Tragic 80.5% |
| Immigrants | Cuba | 0.0 /100 | #320 | Tragic 80.2% |
| Yup'ik | 0.0 /100 | #321 | Tragic 80.0% |
| Lumbee | 0.0 /100 | #322 | Tragic 80.0% |
| Immigrants | Nicaragua | 0.0 /100 | #323 | Tragic 79.9% |
| Mexican American Indians | 0.0 /100 | #324 | Tragic 79.4% |
| Hondurans | 0.0 /100 | #325 | Tragic 79.3% |
| Yuman | 0.0 /100 | #326 | Tragic 79.2% |
| Central Americans | 0.0 /100 | #327 | Tragic 79.2% |
| Hispanics or Latinos | 0.0 /100 | #328 | Tragic 79.1% |