Immigrants from Syria vs Yup'ik GED/Equivalency
COMPARE
Immigrants from Syria
Yup'ik
GED/Equivalency
GED/Equivalency Comparison
Immigrants from Syria
Yup'ik
86.1%
GED/EQUIVALENCY
69.3/ 100
METRIC RATING
161st/ 347
METRIC RANK
80.0%
GED/EQUIVALENCY
0.0/ 100
METRIC RATING
321st/ 347
METRIC RANK
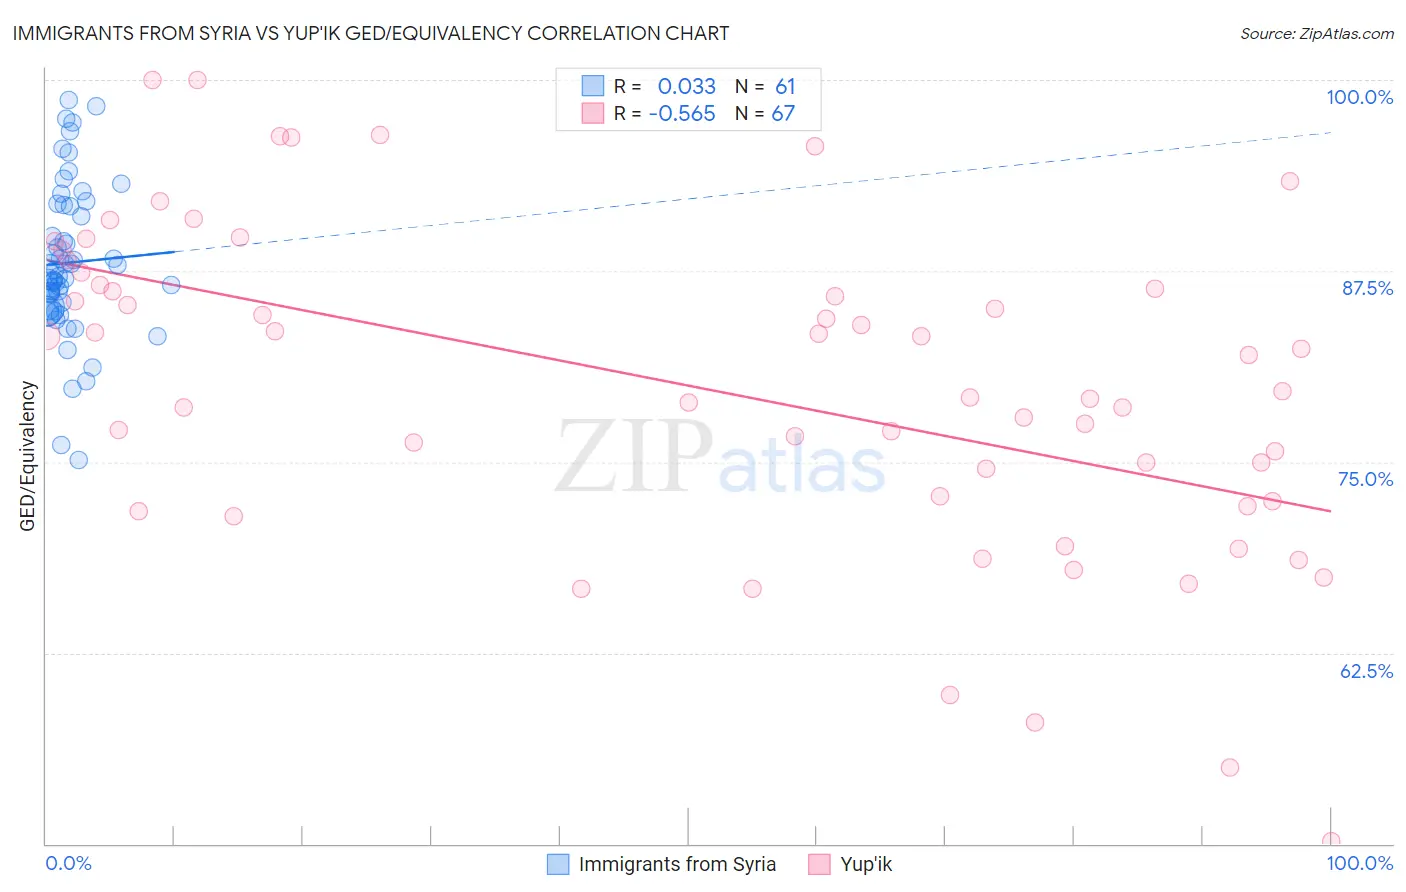
Immigrants from Syria vs Yup'ik GED/Equivalency Correlation Chart
The statistical analysis conducted on geographies consisting of 174,108,882 people shows no correlation between the proportion of Immigrants from Syria and percentage of population with at least ged/equivalency education in the United States with a correlation coefficient (R) of 0.033 and weighted average of 86.1%. Similarly, the statistical analysis conducted on geographies consisting of 39,962,947 people shows a substantial negative correlation between the proportion of Yup'ik and percentage of population with at least ged/equivalency education in the United States with a correlation coefficient (R) of -0.565 and weighted average of 80.0%, a difference of 7.6%.
GED/Equivalency Correlation Summary
| Measurement | Immigrants from Syria | Yup'ik |
| Minimum | 75.1% | 50.2% |
| Maximum | 98.7% | 100.0% |
| Range | 23.5% | 49.8% |
| Mean | 88.0% | 79.9% |
| Median | 87.1% | 79.6% |
| Interquartile 25% (IQ1) | 85.0% | 72.4% |
| Interquartile 75% (IQ3) | 91.8% | 86.6% |
| Interquartile Range (IQR) | 6.7% | 14.2% |
| Standard Deviation (Sample) | 5.0% | 10.6% |
| Standard Deviation (Population) | 4.9% | 10.5% |
Similar Demographics by GED/Equivalency
Demographics Similar to Immigrants from Syria by GED/Equivalency
In terms of ged/equivalency, the demographic groups most similar to Immigrants from Syria are Immigrants from Morocco (86.1%, a difference of 0.010%), Immigrants from Iraq (86.1%, a difference of 0.030%), Immigrants from Kenya (86.2%, a difference of 0.060%), White/Caucasian (86.2%, a difference of 0.070%), and German Russian (86.2%, a difference of 0.070%).
| Demographics | Rating | Rank | GED/Equivalency |
| Armenians | 76.4 /100 | #154 | Good 86.3% |
| Iraqis | 75.2 /100 | #155 | Good 86.2% |
| Immigrants | Nepal | 73.3 /100 | #156 | Good 86.2% |
| Whites/Caucasians | 72.2 /100 | #157 | Good 86.2% |
| German Russians | 72.1 /100 | #158 | Good 86.2% |
| Immigrants | Kenya | 71.8 /100 | #159 | Good 86.2% |
| Immigrants | Morocco | 69.5 /100 | #160 | Good 86.1% |
| Immigrants | Syria | 69.3 /100 | #161 | Good 86.1% |
| Immigrants | Iraq | 68.1 /100 | #162 | Good 86.1% |
| Ugandans | 66.3 /100 | #163 | Good 86.1% |
| Venezuelans | 65.5 /100 | #164 | Good 86.0% |
| Alsatians | 64.3 /100 | #165 | Good 86.0% |
| Immigrants | Albania | 64.2 /100 | #166 | Good 86.0% |
| Ethiopians | 63.7 /100 | #167 | Good 86.0% |
| Sierra Leoneans | 61.8 /100 | #168 | Good 86.0% |
Demographics Similar to Yup'ik by GED/Equivalency
In terms of ged/equivalency, the demographic groups most similar to Yup'ik are Lumbee (80.0%, a difference of 0.070%), Immigrants from Cuba (80.2%, a difference of 0.17%), Immigrants from Nicaragua (79.9%, a difference of 0.19%), Yaqui (80.5%, a difference of 0.58%), and Immigrants from Belize (80.5%, a difference of 0.58%).
| Demographics | Rating | Rank | GED/Equivalency |
| Belizeans | 0.0 /100 | #314 | Tragic 80.9% |
| Apache | 0.0 /100 | #315 | Tragic 80.7% |
| Central American Indians | 0.0 /100 | #316 | Tragic 80.6% |
| Immigrants | Caribbean | 0.0 /100 | #317 | Tragic 80.5% |
| Yaqui | 0.0 /100 | #318 | Tragic 80.5% |
| Immigrants | Belize | 0.0 /100 | #319 | Tragic 80.5% |
| Immigrants | Cuba | 0.0 /100 | #320 | Tragic 80.2% |
| Yup'ik | 0.0 /100 | #321 | Tragic 80.0% |
| Lumbee | 0.0 /100 | #322 | Tragic 80.0% |
| Immigrants | Nicaragua | 0.0 /100 | #323 | Tragic 79.9% |
| Mexican American Indians | 0.0 /100 | #324 | Tragic 79.4% |
| Hondurans | 0.0 /100 | #325 | Tragic 79.3% |
| Yuman | 0.0 /100 | #326 | Tragic 79.2% |
| Central Americans | 0.0 /100 | #327 | Tragic 79.2% |
| Hispanics or Latinos | 0.0 /100 | #328 | Tragic 79.1% |