Finnish vs Immigrants from Vietnam GED/Equivalency
COMPARE
Finnish
Immigrants from Vietnam
GED/Equivalency
GED/Equivalency Comparison
Finns
Immigrants from Vietnam
88.2%
GED/EQUIVALENCY
99.6/ 100
METRIC RATING
41st/ 347
METRIC RANK
83.2%
GED/EQUIVALENCY
0.3/ 100
METRIC RATING
259th/ 347
METRIC RANK
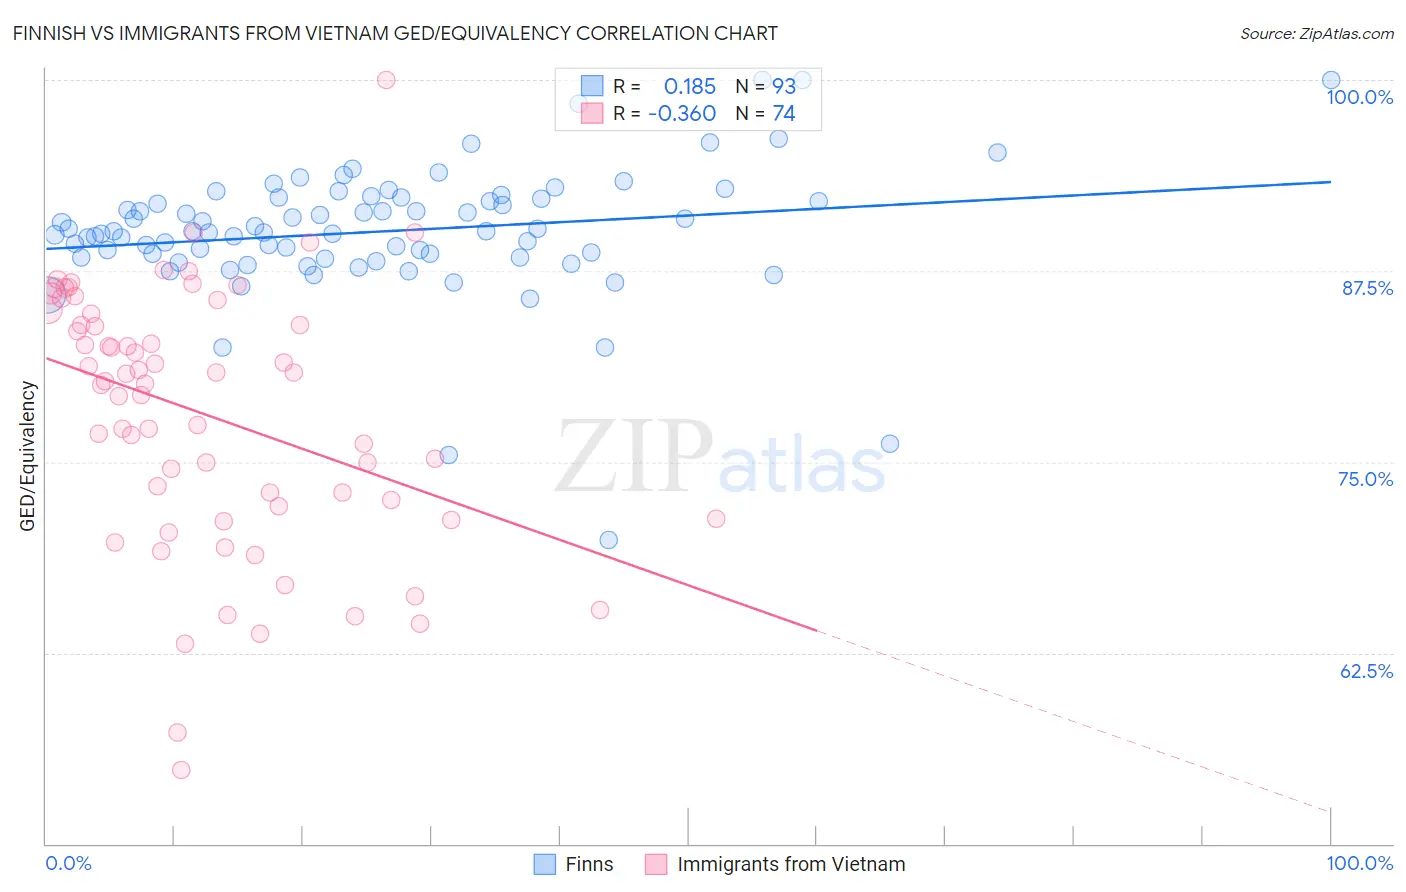
Finnish vs Immigrants from Vietnam GED/Equivalency Correlation Chart
The statistical analysis conducted on geographies consisting of 404,676,025 people shows a poor positive correlation between the proportion of Finns and percentage of population with at least ged/equivalency education in the United States with a correlation coefficient (R) of 0.185 and weighted average of 88.2%. Similarly, the statistical analysis conducted on geographies consisting of 404,843,872 people shows a mild negative correlation between the proportion of Immigrants from Vietnam and percentage of population with at least ged/equivalency education in the United States with a correlation coefficient (R) of -0.360 and weighted average of 83.2%, a difference of 6.0%.
GED/Equivalency Correlation Summary
| Measurement | Finnish | Immigrants from Vietnam |
| Minimum | 69.9% | 54.8% |
| Maximum | 100.0% | 100.0% |
| Range | 30.1% | 45.2% |
| Mean | 90.1% | 78.1% |
| Median | 90.1% | 80.2% |
| Interquartile 25% (IQ1) | 88.4% | 72.1% |
| Interquartile 75% (IQ3) | 92.3% | 84.7% |
| Interquartile Range (IQR) | 3.9% | 12.6% |
| Standard Deviation (Sample) | 4.4% | 8.5% |
| Standard Deviation (Population) | 4.3% | 8.5% |
Similar Demographics by GED/Equivalency
Demographics Similar to Finns by GED/Equivalency
In terms of ged/equivalency, the demographic groups most similar to Finns are Italian (88.2%, a difference of 0.010%), Immigrants from Israel (88.2%, a difference of 0.030%), Cambodian (88.2%, a difference of 0.030%), Immigrants from Scotland (88.2%, a difference of 0.030%), and Macedonian (88.1%, a difference of 0.060%).
| Demographics | Rating | Rank | GED/Equivalency |
| Immigrants | Japan | 99.7 /100 | #34 | Exceptional 88.4% |
| Immigrants | South Central Asia | 99.7 /100 | #35 | Exceptional 88.4% |
| Immigrants | Belgium | 99.7 /100 | #36 | Exceptional 88.3% |
| Immigrants | Austria | 99.7 /100 | #37 | Exceptional 88.3% |
| Burmese | 99.7 /100 | #38 | Exceptional 88.3% |
| Immigrants | Israel | 99.6 /100 | #39 | Exceptional 88.2% |
| Italians | 99.6 /100 | #40 | Exceptional 88.2% |
| Finns | 99.6 /100 | #41 | Exceptional 88.2% |
| Cambodians | 99.6 /100 | #42 | Exceptional 88.2% |
| Immigrants | Scotland | 99.6 /100 | #43 | Exceptional 88.2% |
| Macedonians | 99.5 /100 | #44 | Exceptional 88.1% |
| Czechs | 99.5 /100 | #45 | Exceptional 88.1% |
| Immigrants | Switzerland | 99.5 /100 | #46 | Exceptional 88.1% |
| Immigrants | Latvia | 99.5 /100 | #47 | Exceptional 88.1% |
| Greeks | 99.5 /100 | #48 | Exceptional 88.1% |
Demographics Similar to Immigrants from Vietnam by GED/Equivalency
In terms of ged/equivalency, the demographic groups most similar to Immigrants from Vietnam are Choctaw (83.1%, a difference of 0.030%), Inupiat (83.1%, a difference of 0.090%), Immigrants from Armenia (83.1%, a difference of 0.090%), Immigrants from Congo (83.1%, a difference of 0.10%), and Bangladeshi (83.1%, a difference of 0.11%).
| Demographics | Rating | Rank | GED/Equivalency |
| Bahamians | 0.8 /100 | #252 | Tragic 83.6% |
| Comanche | 0.7 /100 | #253 | Tragic 83.6% |
| Creek | 0.7 /100 | #254 | Tragic 83.6% |
| Colville | 0.5 /100 | #255 | Tragic 83.4% |
| Africans | 0.5 /100 | #256 | Tragic 83.4% |
| Jamaicans | 0.4 /100 | #257 | Tragic 83.3% |
| Malaysians | 0.4 /100 | #258 | Tragic 83.3% |
| Immigrants | Vietnam | 0.3 /100 | #259 | Tragic 83.2% |
| Choctaw | 0.3 /100 | #260 | Tragic 83.1% |
| Inupiat | 0.2 /100 | #261 | Tragic 83.1% |
| Immigrants | Armenia | 0.2 /100 | #262 | Tragic 83.1% |
| Immigrants | Congo | 0.2 /100 | #263 | Tragic 83.1% |
| Bangladeshis | 0.2 /100 | #264 | Tragic 83.1% |
| West Indians | 0.2 /100 | #265 | Tragic 83.1% |
| Kiowa | 0.2 /100 | #266 | Tragic 83.1% |