Finnish vs Immigrants from Jamaica GED/Equivalency
COMPARE
Finnish
Immigrants from Jamaica
GED/Equivalency
GED/Equivalency Comparison
Finns
Immigrants from Jamaica
88.2%
GED/EQUIVALENCY
99.6/ 100
METRIC RATING
41st/ 347
METRIC RANK
82.9%
GED/EQUIVALENCY
0.2/ 100
METRIC RATING
270th/ 347
METRIC RANK
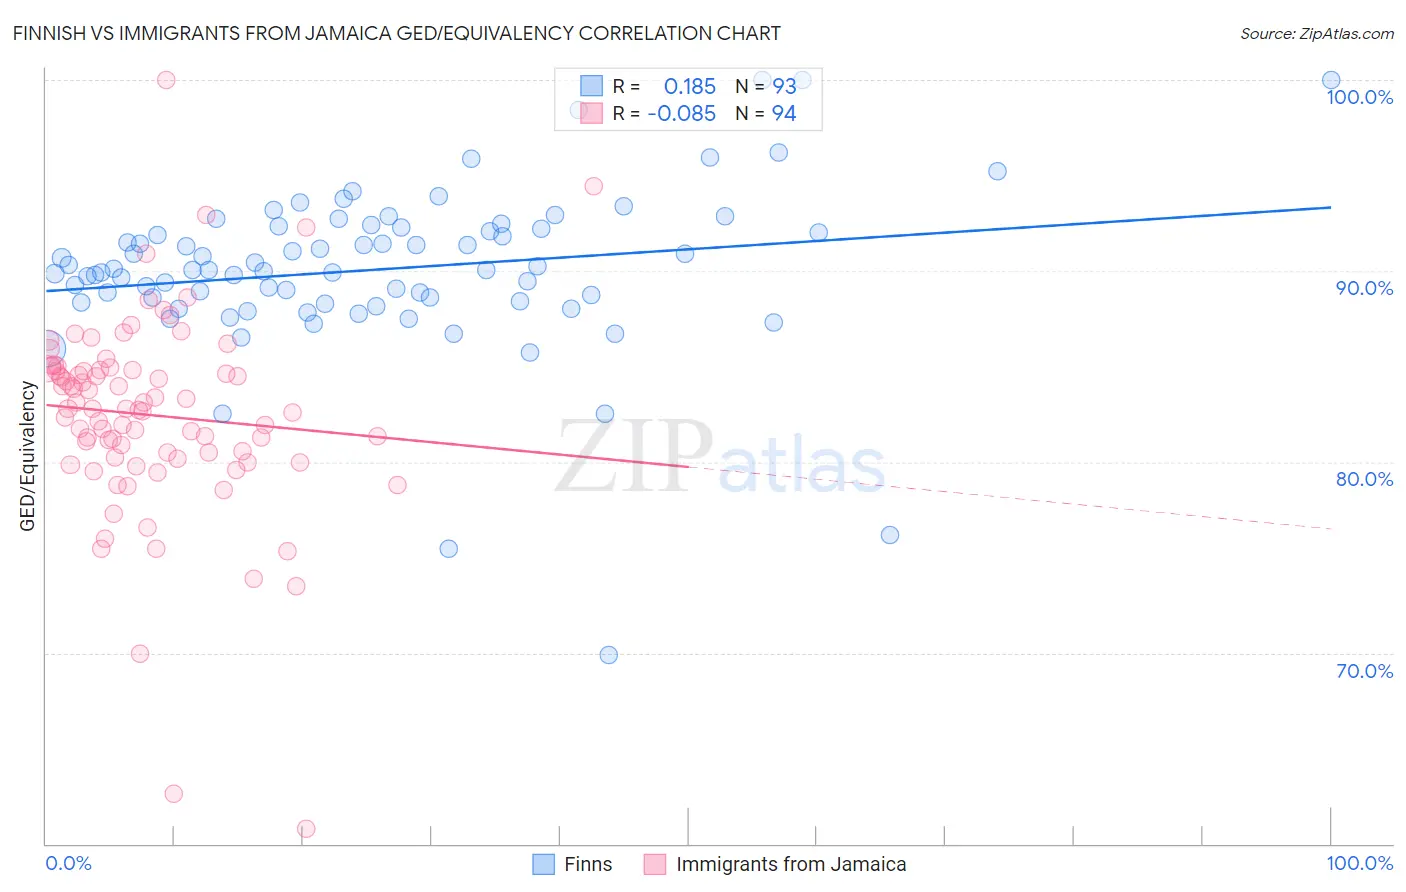
Finnish vs Immigrants from Jamaica GED/Equivalency Correlation Chart
The statistical analysis conducted on geographies consisting of 404,676,025 people shows a poor positive correlation between the proportion of Finns and percentage of population with at least ged/equivalency education in the United States with a correlation coefficient (R) of 0.185 and weighted average of 88.2%. Similarly, the statistical analysis conducted on geographies consisting of 301,829,399 people shows a slight negative correlation between the proportion of Immigrants from Jamaica and percentage of population with at least ged/equivalency education in the United States with a correlation coefficient (R) of -0.085 and weighted average of 82.9%, a difference of 6.3%.
GED/Equivalency Correlation Summary
| Measurement | Finnish | Immigrants from Jamaica |
| Minimum | 69.9% | 60.8% |
| Maximum | 100.0% | 100.0% |
| Range | 30.1% | 39.2% |
| Mean | 90.1% | 82.4% |
| Median | 90.1% | 82.8% |
| Interquartile 25% (IQ1) | 88.4% | 80.2% |
| Interquartile 75% (IQ3) | 92.3% | 84.8% |
| Interquartile Range (IQR) | 3.9% | 4.6% |
| Standard Deviation (Sample) | 4.4% | 5.4% |
| Standard Deviation (Population) | 4.3% | 5.3% |
Similar Demographics by GED/Equivalency
Demographics Similar to Finns by GED/Equivalency
In terms of ged/equivalency, the demographic groups most similar to Finns are Italian (88.2%, a difference of 0.010%), Immigrants from Israel (88.2%, a difference of 0.030%), Cambodian (88.2%, a difference of 0.030%), Immigrants from Scotland (88.2%, a difference of 0.030%), and Macedonian (88.1%, a difference of 0.060%).
| Demographics | Rating | Rank | GED/Equivalency |
| Immigrants | Japan | 99.7 /100 | #34 | Exceptional 88.4% |
| Immigrants | South Central Asia | 99.7 /100 | #35 | Exceptional 88.4% |
| Immigrants | Belgium | 99.7 /100 | #36 | Exceptional 88.3% |
| Immigrants | Austria | 99.7 /100 | #37 | Exceptional 88.3% |
| Burmese | 99.7 /100 | #38 | Exceptional 88.3% |
| Immigrants | Israel | 99.6 /100 | #39 | Exceptional 88.2% |
| Italians | 99.6 /100 | #40 | Exceptional 88.2% |
| Finns | 99.6 /100 | #41 | Exceptional 88.2% |
| Cambodians | 99.6 /100 | #42 | Exceptional 88.2% |
| Immigrants | Scotland | 99.6 /100 | #43 | Exceptional 88.2% |
| Macedonians | 99.5 /100 | #44 | Exceptional 88.1% |
| Czechs | 99.5 /100 | #45 | Exceptional 88.1% |
| Immigrants | Switzerland | 99.5 /100 | #46 | Exceptional 88.1% |
| Immigrants | Latvia | 99.5 /100 | #47 | Exceptional 88.1% |
| Greeks | 99.5 /100 | #48 | Exceptional 88.1% |
Demographics Similar to Immigrants from Jamaica by GED/Equivalency
In terms of ged/equivalency, the demographic groups most similar to Immigrants from Jamaica are U.S. Virgin Islander (82.9%, a difference of 0.040%), Hopi (83.0%, a difference of 0.050%), Barbadian (82.9%, a difference of 0.080%), Pennsylvania German (82.9%, a difference of 0.090%), and Immigrants from Burma/Myanmar (83.0%, a difference of 0.10%).
| Demographics | Rating | Rank | GED/Equivalency |
| Immigrants | Congo | 0.2 /100 | #263 | Tragic 83.1% |
| Bangladeshis | 0.2 /100 | #264 | Tragic 83.1% |
| West Indians | 0.2 /100 | #265 | Tragic 83.1% |
| Kiowa | 0.2 /100 | #266 | Tragic 83.1% |
| Trinidadians and Tobagonians | 0.2 /100 | #267 | Tragic 83.0% |
| Immigrants | Burma/Myanmar | 0.2 /100 | #268 | Tragic 83.0% |
| Hopi | 0.2 /100 | #269 | Tragic 83.0% |
| Immigrants | Jamaica | 0.2 /100 | #270 | Tragic 82.9% |
| U.S. Virgin Islanders | 0.2 /100 | #271 | Tragic 82.9% |
| Barbadians | 0.1 /100 | #272 | Tragic 82.9% |
| Pennsylvania Germans | 0.1 /100 | #273 | Tragic 82.9% |
| Immigrants | Trinidad and Tobago | 0.1 /100 | #274 | Tragic 82.8% |
| Seminole | 0.1 /100 | #275 | Tragic 82.8% |
| Blacks/African Americans | 0.1 /100 | #276 | Tragic 82.8% |
| Arapaho | 0.1 /100 | #277 | Tragic 82.8% |