Finnish vs Scandinavian GED/Equivalency
COMPARE
Finnish
Scandinavian
GED/Equivalency
GED/Equivalency Comparison
Finns
Scandinavians
88.2%
GED/EQUIVALENCY
99.6/ 100
METRIC RATING
41st/ 347
METRIC RANK
87.9%
GED/EQUIVALENCY
99.3/ 100
METRIC RATING
60th/ 347
METRIC RANK
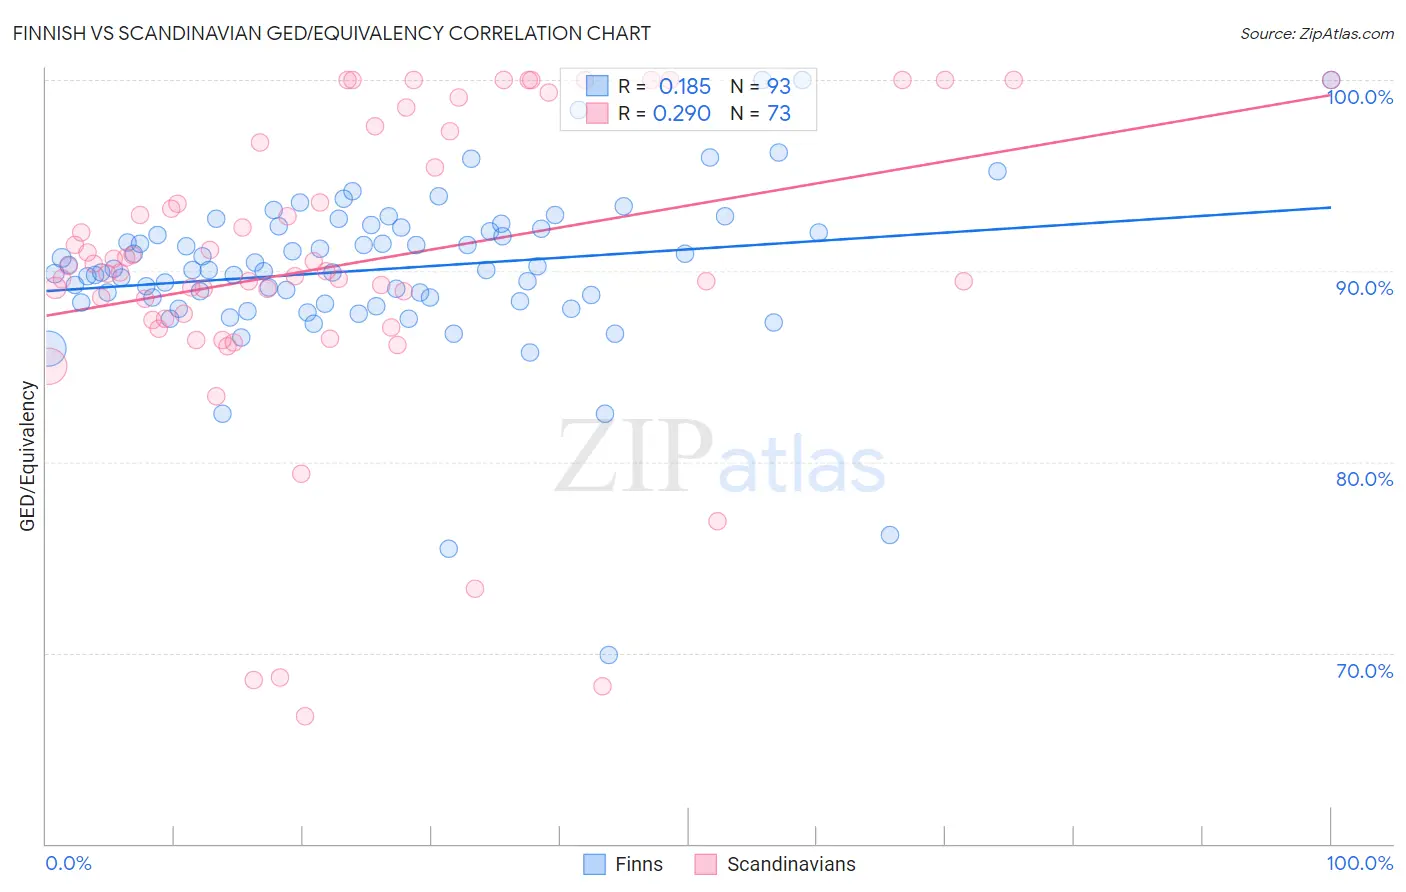
Finnish vs Scandinavian GED/Equivalency Correlation Chart
The statistical analysis conducted on geographies consisting of 404,676,025 people shows a poor positive correlation between the proportion of Finns and percentage of population with at least ged/equivalency education in the United States with a correlation coefficient (R) of 0.185 and weighted average of 88.2%. Similarly, the statistical analysis conducted on geographies consisting of 472,660,435 people shows a weak positive correlation between the proportion of Scandinavians and percentage of population with at least ged/equivalency education in the United States with a correlation coefficient (R) of 0.290 and weighted average of 87.9%, a difference of 0.30%.
GED/Equivalency Correlation Summary
| Measurement | Finnish | Scandinavian |
| Minimum | 69.9% | 66.7% |
| Maximum | 100.0% | 100.0% |
| Range | 30.1% | 33.3% |
| Mean | 90.1% | 90.3% |
| Median | 90.1% | 90.0% |
| Interquartile 25% (IQ1) | 88.4% | 87.5% |
| Interquartile 75% (IQ3) | 92.3% | 97.0% |
| Interquartile Range (IQR) | 3.9% | 9.6% |
| Standard Deviation (Sample) | 4.4% | 7.9% |
| Standard Deviation (Population) | 4.3% | 7.8% |
Demographics Similar to Finns and Scandinavians by GED/Equivalency
In terms of ged/equivalency, the demographic groups most similar to Finns are Italian (88.2%, a difference of 0.010%), Cambodian (88.2%, a difference of 0.030%), Immigrants from Scotland (88.2%, a difference of 0.030%), Macedonian (88.1%, a difference of 0.060%), and Czech (88.1%, a difference of 0.10%). Similarly, the demographic groups most similar to Scandinavians are Serbian (87.9%, a difference of 0.010%), Immigrants from Czechoslovakia (87.9%, a difference of 0.020%), Northern European (87.9%, a difference of 0.020%), Immigrants from Denmark (88.0%, a difference of 0.070%), and New Zealander (88.0%, a difference of 0.080%).
| Demographics | Rating | Rank | GED/Equivalency |
| Italians | 99.6 /100 | #40 | Exceptional 88.2% |
| Finns | 99.6 /100 | #41 | Exceptional 88.2% |
| Cambodians | 99.6 /100 | #42 | Exceptional 88.2% |
| Immigrants | Scotland | 99.6 /100 | #43 | Exceptional 88.2% |
| Macedonians | 99.5 /100 | #44 | Exceptional 88.1% |
| Czechs | 99.5 /100 | #45 | Exceptional 88.1% |
| Immigrants | Switzerland | 99.5 /100 | #46 | Exceptional 88.1% |
| Immigrants | Latvia | 99.5 /100 | #47 | Exceptional 88.1% |
| Greeks | 99.5 /100 | #48 | Exceptional 88.1% |
| Australians | 99.5 /100 | #49 | Exceptional 88.1% |
| Immigrants | Korea | 99.5 /100 | #50 | Exceptional 88.1% |
| Immigrants | Netherlands | 99.4 /100 | #51 | Exceptional 88.0% |
| Zimbabweans | 99.4 /100 | #52 | Exceptional 88.0% |
| Immigrants | South Africa | 99.4 /100 | #53 | Exceptional 88.0% |
| Soviet Union | 99.4 /100 | #54 | Exceptional 88.0% |
| New Zealanders | 99.4 /100 | #55 | Exceptional 88.0% |
| Immigrants | Denmark | 99.4 /100 | #56 | Exceptional 88.0% |
| Immigrants | Czechoslovakia | 99.3 /100 | #57 | Exceptional 87.9% |
| Northern Europeans | 99.3 /100 | #58 | Exceptional 87.9% |
| Serbians | 99.3 /100 | #59 | Exceptional 87.9% |
| Scandinavians | 99.3 /100 | #60 | Exceptional 87.9% |