Comanche vs British No Schooling Completed
COMPARE
Comanche
British
No Schooling Completed
No Schooling Completed Comparison
Comanche
British
2.1%
NO SCHOOLING COMPLETED
60.7/ 100
METRIC RATING
164th/ 347
METRIC RANK
1.5%
NO SCHOOLING COMPLETED
100.0/ 100
METRIC RATING
30th/ 347
METRIC RANK
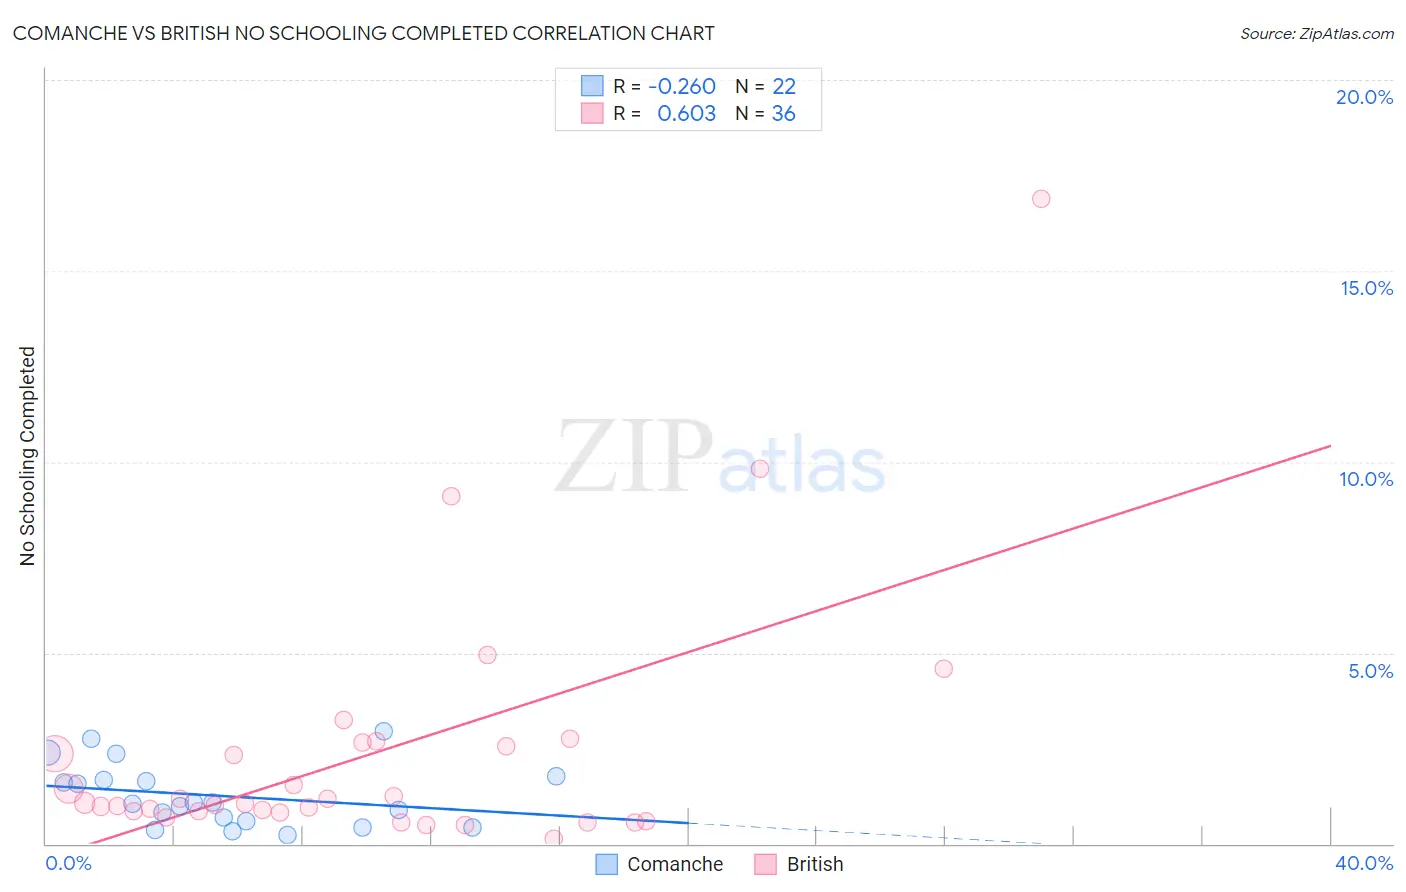
Comanche vs British No Schooling Completed Correlation Chart
The statistical analysis conducted on geographies consisting of 109,390,428 people shows a weak negative correlation between the proportion of Comanche and percentage of population with no schooling in the United States with a correlation coefficient (R) of -0.260 and weighted average of 2.1%. Similarly, the statistical analysis conducted on geographies consisting of 518,649,413 people shows a significant positive correlation between the proportion of British and percentage of population with no schooling in the United States with a correlation coefficient (R) of 0.603 and weighted average of 1.5%, a difference of 35.5%.
No Schooling Completed Correlation Summary
| Measurement | Comanche | British |
| Minimum | 0.23% | 0.14% |
| Maximum | 2.9% | 16.9% |
| Range | 2.7% | 16.8% |
| Mean | 1.3% | 2.4% |
| Median | 1.1% | 1.1% |
| Interquartile 25% (IQ1) | 0.59% | 0.83% |
| Interquartile 75% (IQ3) | 1.7% | 2.6% |
| Interquartile Range (IQR) | 1.1% | 1.8% |
| Standard Deviation (Sample) | 0.81% | 3.3% |
| Standard Deviation (Population) | 0.79% | 3.3% |
Similar Demographics by No Schooling Completed
Demographics Similar to Comanche by No Schooling Completed
In terms of no schooling completed, the demographic groups most similar to Comanche are Brazilian (2.1%, a difference of 0.060%), Dutch West Indian (2.1%, a difference of 0.11%), Egyptian (2.1%, a difference of 0.21%), Albanian (2.1%, a difference of 0.22%), and Cheyenne (2.1%, a difference of 0.29%).
| Demographics | Rating | Rank | No Schooling Completed |
| Immigrants | Sri Lanka | 67.0 /100 | #157 | Good 2.0% |
| Immigrants | Korea | 66.7 /100 | #158 | Good 2.0% |
| Immigrants | Spain | 66.4 /100 | #159 | Good 2.0% |
| Kenyans | 65.7 /100 | #160 | Good 2.0% |
| Ugandans | 64.6 /100 | #161 | Good 2.0% |
| Immigrants | Brazil | 63.8 /100 | #162 | Good 2.1% |
| Albanians | 62.2 /100 | #163 | Good 2.1% |
| Comanche | 60.7 /100 | #164 | Good 2.1% |
| Brazilians | 60.2 /100 | #165 | Good 2.1% |
| Dutch West Indians | 59.9 /100 | #166 | Average 2.1% |
| Egyptians | 59.2 /100 | #167 | Average 2.1% |
| Cheyenne | 58.6 /100 | #168 | Average 2.1% |
| Apache | 56.7 /100 | #169 | Average 2.1% |
| Argentineans | 56.0 /100 | #170 | Average 2.1% |
| Immigrants | Poland | 55.2 /100 | #171 | Average 2.1% |
Demographics Similar to British by No Schooling Completed
In terms of no schooling completed, the demographic groups most similar to British are Inupiat (1.5%, a difference of 0.030%), Swiss (1.5%, a difference of 0.42%), Lumbee (1.5%, a difference of 0.48%), Italian (1.5%, a difference of 1.1%), and Latvian (1.5%, a difference of 1.4%).
| Demographics | Rating | Rank | No Schooling Completed |
| Europeans | 100.0 /100 | #23 | Exceptional 1.5% |
| Pennsylvania Germans | 100.0 /100 | #24 | Exceptional 1.5% |
| French | 100.0 /100 | #25 | Exceptional 1.5% |
| Czechs | 100.0 /100 | #26 | Exceptional 1.5% |
| Scandinavians | 100.0 /100 | #27 | Exceptional 1.5% |
| French Canadians | 100.0 /100 | #28 | Exceptional 1.5% |
| Lumbee | 100.0 /100 | #29 | Exceptional 1.5% |
| British | 100.0 /100 | #30 | Exceptional 1.5% |
| Inupiat | 100.0 /100 | #31 | Exceptional 1.5% |
| Swiss | 100.0 /100 | #32 | Exceptional 1.5% |
| Italians | 100.0 /100 | #33 | Exceptional 1.5% |
| Latvians | 100.0 /100 | #34 | Exceptional 1.5% |
| Eastern Europeans | 100.0 /100 | #35 | Exceptional 1.6% |
| Aleuts | 99.9 /100 | #36 | Exceptional 1.6% |
| Belgians | 99.9 /100 | #37 | Exceptional 1.6% |