Syrian vs British College, 1 year or more
COMPARE
Syrian
British
College, 1 year or more
College, 1 year or more Comparison
Syrians
British
61.9%
COLLEGE, 1 YEAR OR MORE
95.7/ 100
METRIC RATING
108th/ 347
METRIC RANK
62.3%
COLLEGE, 1 YEAR OR MORE
97.4/ 100
METRIC RATING
95th/ 347
METRIC RANK
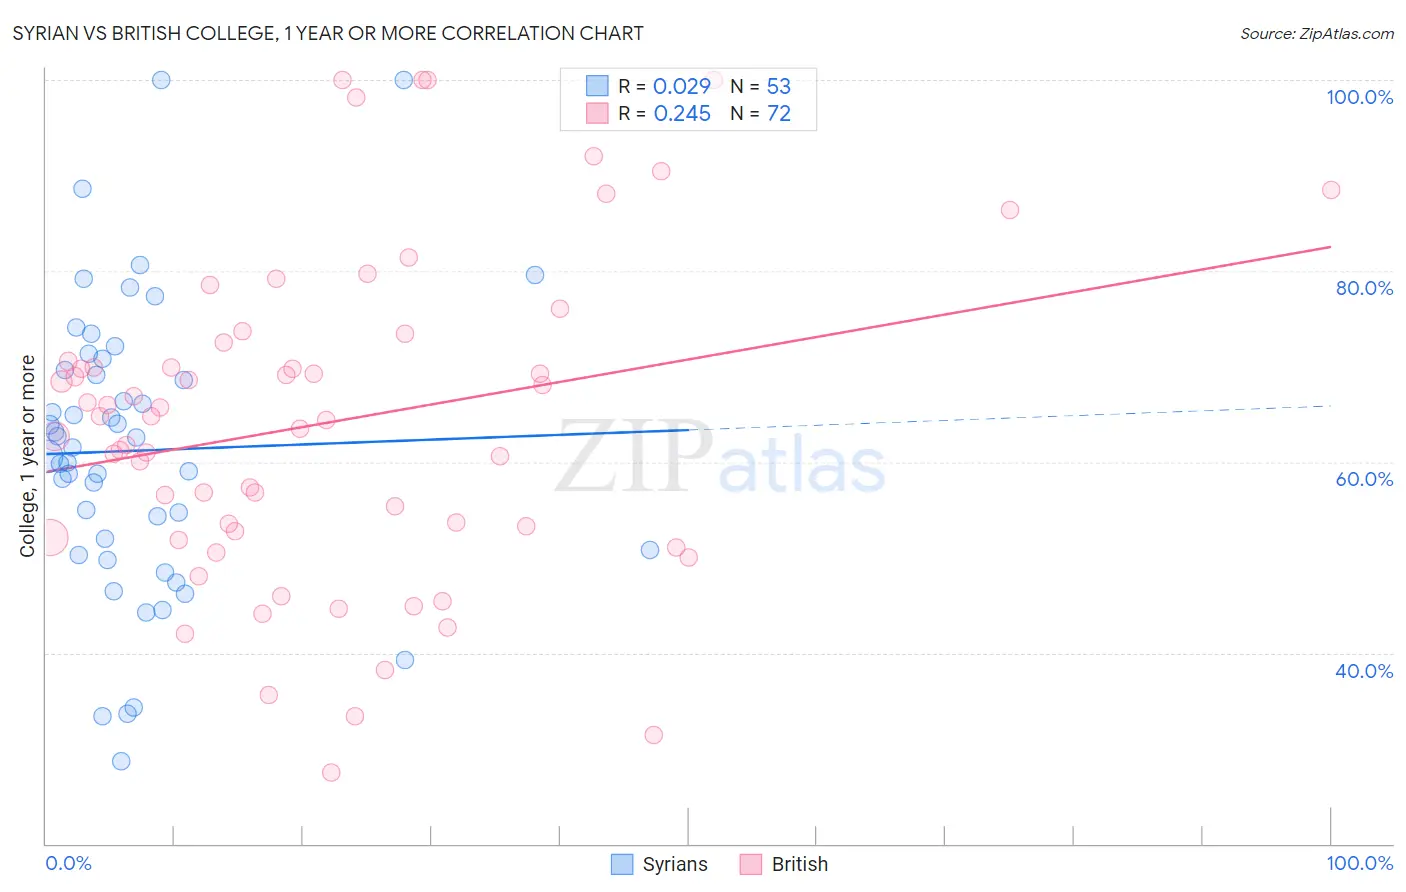
Syrian vs British College, 1 year or more Correlation Chart
The statistical analysis conducted on geographies consisting of 266,306,496 people shows no correlation between the proportion of Syrians and percentage of population with at least college, 1 year or more education in the United States with a correlation coefficient (R) of 0.029 and weighted average of 61.9%. Similarly, the statistical analysis conducted on geographies consisting of 531,458,915 people shows a weak positive correlation between the proportion of British and percentage of population with at least college, 1 year or more education in the United States with a correlation coefficient (R) of 0.245 and weighted average of 62.3%, a difference of 0.66%.
College, 1 year or more Correlation Summary
| Measurement | Syrian | British |
| Minimum | 28.6% | 27.5% |
| Maximum | 100.0% | 100.0% |
| Range | 71.4% | 72.5% |
| Mean | 61.2% | 64.1% |
| Median | 61.5% | 64.6% |
| Interquartile 25% (IQ1) | 50.5% | 52.5% |
| Interquartile 75% (IQ3) | 70.2% | 71.5% |
| Interquartile Range (IQR) | 19.7% | 19.0% |
| Standard Deviation (Sample) | 15.2% | 17.1% |
| Standard Deviation (Population) | 15.1% | 17.0% |
Demographics Similar to Syrians and British by College, 1 year or more
In terms of college, 1 year or more, the demographic groups most similar to Syrians are Immigrants from Northern Africa (61.9%, a difference of 0.0%), Immigrants from Ukraine (61.9%, a difference of 0.020%), European (61.8%, a difference of 0.020%), Macedonian (61.8%, a difference of 0.020%), and Palestinian (62.0%, a difference of 0.20%). Similarly, the demographic groups most similar to British are Immigrants from Croatia (62.3%, a difference of 0.10%), Chinese (62.2%, a difference of 0.12%), Jordanian (62.2%, a difference of 0.12%), Carpatho Rusyn (62.2%, a difference of 0.12%), and Croatian (62.2%, a difference of 0.13%).
| Demographics | Rating | Rank | College, 1 year or more |
| Immigrants | Eastern Europe | 97.8 /100 | #91 | Exceptional 62.4% |
| Immigrants | Egypt | 97.8 /100 | #92 | Exceptional 62.4% |
| Romanians | 97.7 /100 | #93 | Exceptional 62.4% |
| Immigrants | Croatia | 97.6 /100 | #94 | Exceptional 62.3% |
| British | 97.4 /100 | #95 | Exceptional 62.3% |
| Chinese | 97.2 /100 | #96 | Exceptional 62.2% |
| Jordanians | 97.2 /100 | #97 | Exceptional 62.2% |
| Carpatho Rusyns | 97.2 /100 | #98 | Exceptional 62.2% |
| Croatians | 97.1 /100 | #99 | Exceptional 62.2% |
| Icelanders | 96.8 /100 | #100 | Exceptional 62.1% |
| Swedes | 96.8 /100 | #101 | Exceptional 62.1% |
| Luxembourgers | 96.7 /100 | #102 | Exceptional 62.1% |
| Afghans | 96.4 /100 | #103 | Exceptional 62.0% |
| Chileans | 96.4 /100 | #104 | Exceptional 62.0% |
| Immigrants | Nepal | 96.3 /100 | #105 | Exceptional 62.0% |
| Palestinians | 96.3 /100 | #106 | Exceptional 62.0% |
| Immigrants | Ukraine | 95.8 /100 | #107 | Exceptional 61.9% |
| Syrians | 95.7 /100 | #108 | Exceptional 61.9% |
| Immigrants | Northern Africa | 95.7 /100 | #109 | Exceptional 61.9% |
| Europeans | 95.6 /100 | #110 | Exceptional 61.8% |
| Macedonians | 95.6 /100 | #111 | Exceptional 61.8% |