Russian vs British College, 1 year or more
COMPARE
Russian
British
College, 1 year or more
College, 1 year or more Comparison
Russians
British
65.1%
COLLEGE, 1 YEAR OR MORE
99.9/ 100
METRIC RATING
37th/ 347
METRIC RANK
62.3%
COLLEGE, 1 YEAR OR MORE
97.4/ 100
METRIC RATING
95th/ 347
METRIC RANK
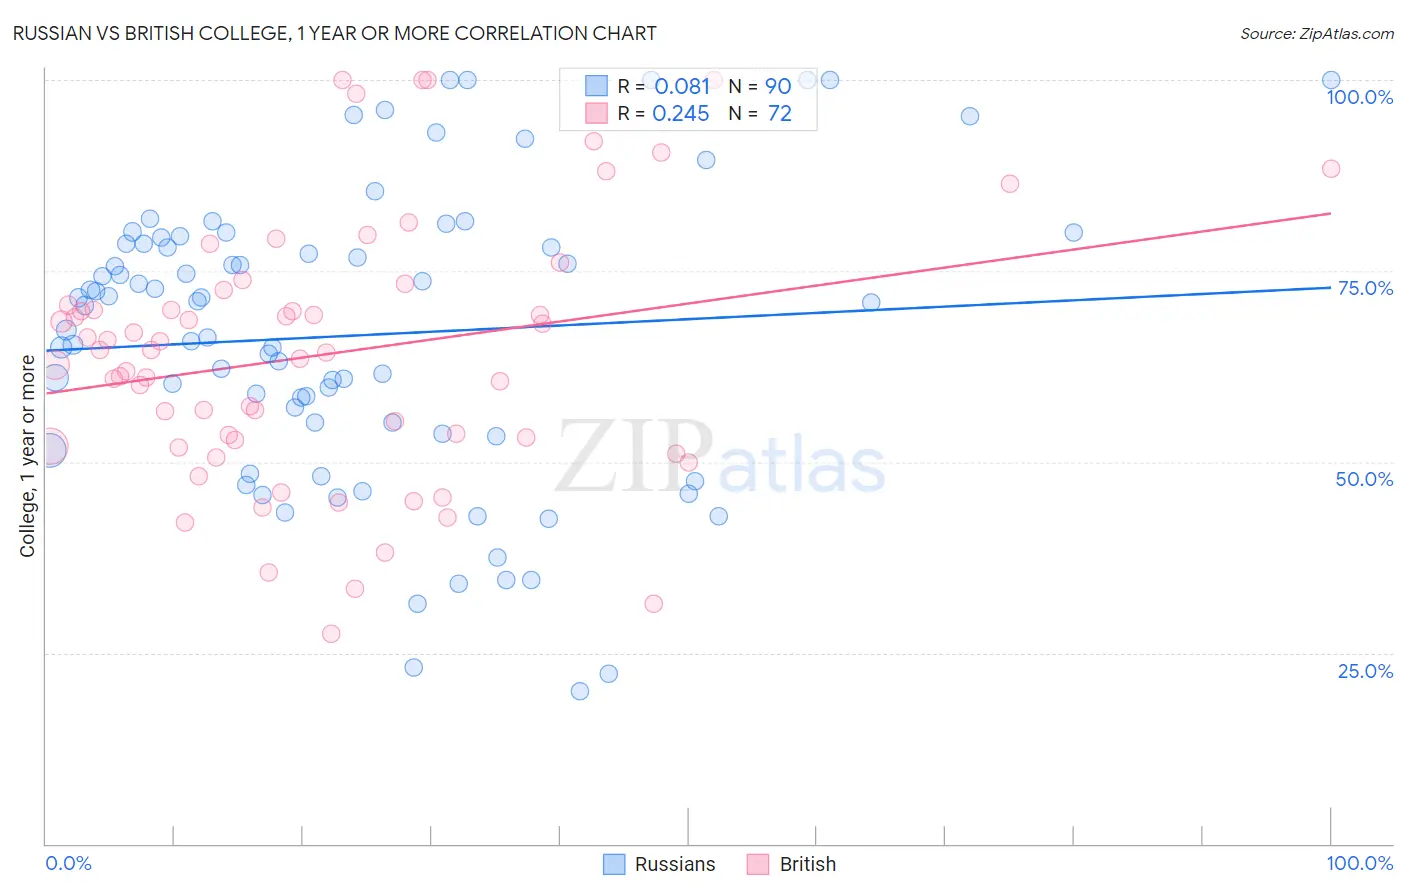
Russian vs British College, 1 year or more Correlation Chart
The statistical analysis conducted on geographies consisting of 512,253,634 people shows a slight positive correlation between the proportion of Russians and percentage of population with at least college, 1 year or more education in the United States with a correlation coefficient (R) of 0.081 and weighted average of 65.1%. Similarly, the statistical analysis conducted on geographies consisting of 531,458,915 people shows a weak positive correlation between the proportion of British and percentage of population with at least college, 1 year or more education in the United States with a correlation coefficient (R) of 0.245 and weighted average of 62.3%, a difference of 4.6%.
College, 1 year or more Correlation Summary
| Measurement | Russian | British |
| Minimum | 20.0% | 27.5% |
| Maximum | 100.0% | 100.0% |
| Range | 80.0% | 72.5% |
| Mean | 66.6% | 64.1% |
| Median | 70.6% | 64.6% |
| Interquartile 25% (IQ1) | 53.7% | 52.5% |
| Interquartile 75% (IQ3) | 78.6% | 71.5% |
| Interquartile Range (IQR) | 24.9% | 19.0% |
| Standard Deviation (Sample) | 19.2% | 17.1% |
| Standard Deviation (Population) | 19.1% | 17.0% |
Similar Demographics by College, 1 year or more
Demographics Similar to Russians by College, 1 year or more
In terms of college, 1 year or more, the demographic groups most similar to Russians are Immigrants from South Africa (65.1%, a difference of 0.010%), Immigrants from Turkey (65.2%, a difference of 0.090%), Immigrants from Saudi Arabia (65.0%, a difference of 0.15%), Estonian (65.0%, a difference of 0.22%), and Israeli (65.3%, a difference of 0.28%).
| Demographics | Rating | Rank | College, 1 year or more |
| Immigrants | Denmark | 100.0 /100 | #30 | Exceptional 65.6% |
| Turks | 100.0 /100 | #31 | Exceptional 65.5% |
| Bulgarians | 100.0 /100 | #32 | Exceptional 65.5% |
| Immigrants | Sri Lanka | 99.9 /100 | #33 | Exceptional 65.4% |
| Israelis | 99.9 /100 | #34 | Exceptional 65.3% |
| Immigrants | Turkey | 99.9 /100 | #35 | Exceptional 65.2% |
| Immigrants | South Africa | 99.9 /100 | #36 | Exceptional 65.1% |
| Russians | 99.9 /100 | #37 | Exceptional 65.1% |
| Immigrants | Saudi Arabia | 99.9 /100 | #38 | Exceptional 65.0% |
| Estonians | 99.9 /100 | #39 | Exceptional 65.0% |
| Immigrants | Kuwait | 99.9 /100 | #40 | Exceptional 65.0% |
| Mongolians | 99.9 /100 | #41 | Exceptional 64.8% |
| Immigrants | Latvia | 99.9 /100 | #42 | Exceptional 64.8% |
| Immigrants | Russia | 99.9 /100 | #43 | Exceptional 64.7% |
| Immigrants | Norway | 99.9 /100 | #44 | Exceptional 64.7% |
Demographics Similar to British by College, 1 year or more
In terms of college, 1 year or more, the demographic groups most similar to British are Immigrants from Croatia (62.3%, a difference of 0.10%), Chinese (62.2%, a difference of 0.12%), Jordanian (62.2%, a difference of 0.12%), Carpatho Rusyn (62.2%, a difference of 0.12%), and Croatian (62.2%, a difference of 0.13%).
| Demographics | Rating | Rank | College, 1 year or more |
| Greeks | 98.3 /100 | #88 | Exceptional 62.6% |
| Immigrants | Ethiopia | 98.2 /100 | #89 | Exceptional 62.6% |
| Immigrants | Western Asia | 97.9 /100 | #90 | Exceptional 62.5% |
| Immigrants | Eastern Europe | 97.8 /100 | #91 | Exceptional 62.4% |
| Immigrants | Egypt | 97.8 /100 | #92 | Exceptional 62.4% |
| Romanians | 97.7 /100 | #93 | Exceptional 62.4% |
| Immigrants | Croatia | 97.6 /100 | #94 | Exceptional 62.3% |
| British | 97.4 /100 | #95 | Exceptional 62.3% |
| Chinese | 97.2 /100 | #96 | Exceptional 62.2% |
| Jordanians | 97.2 /100 | #97 | Exceptional 62.2% |
| Carpatho Rusyns | 97.2 /100 | #98 | Exceptional 62.2% |
| Croatians | 97.1 /100 | #99 | Exceptional 62.2% |
| Icelanders | 96.8 /100 | #100 | Exceptional 62.1% |
| Swedes | 96.8 /100 | #101 | Exceptional 62.1% |
| Luxembourgers | 96.7 /100 | #102 | Exceptional 62.1% |