Ghanaian vs British College, 1 year or more
COMPARE
Ghanaian
British
College, 1 year or more
College, 1 year or more Comparison
Ghanaians
British
58.4%
COLLEGE, 1 YEAR OR MORE
20.9/ 100
METRIC RATING
203rd/ 347
METRIC RANK
62.3%
COLLEGE, 1 YEAR OR MORE
97.4/ 100
METRIC RATING
95th/ 347
METRIC RANK
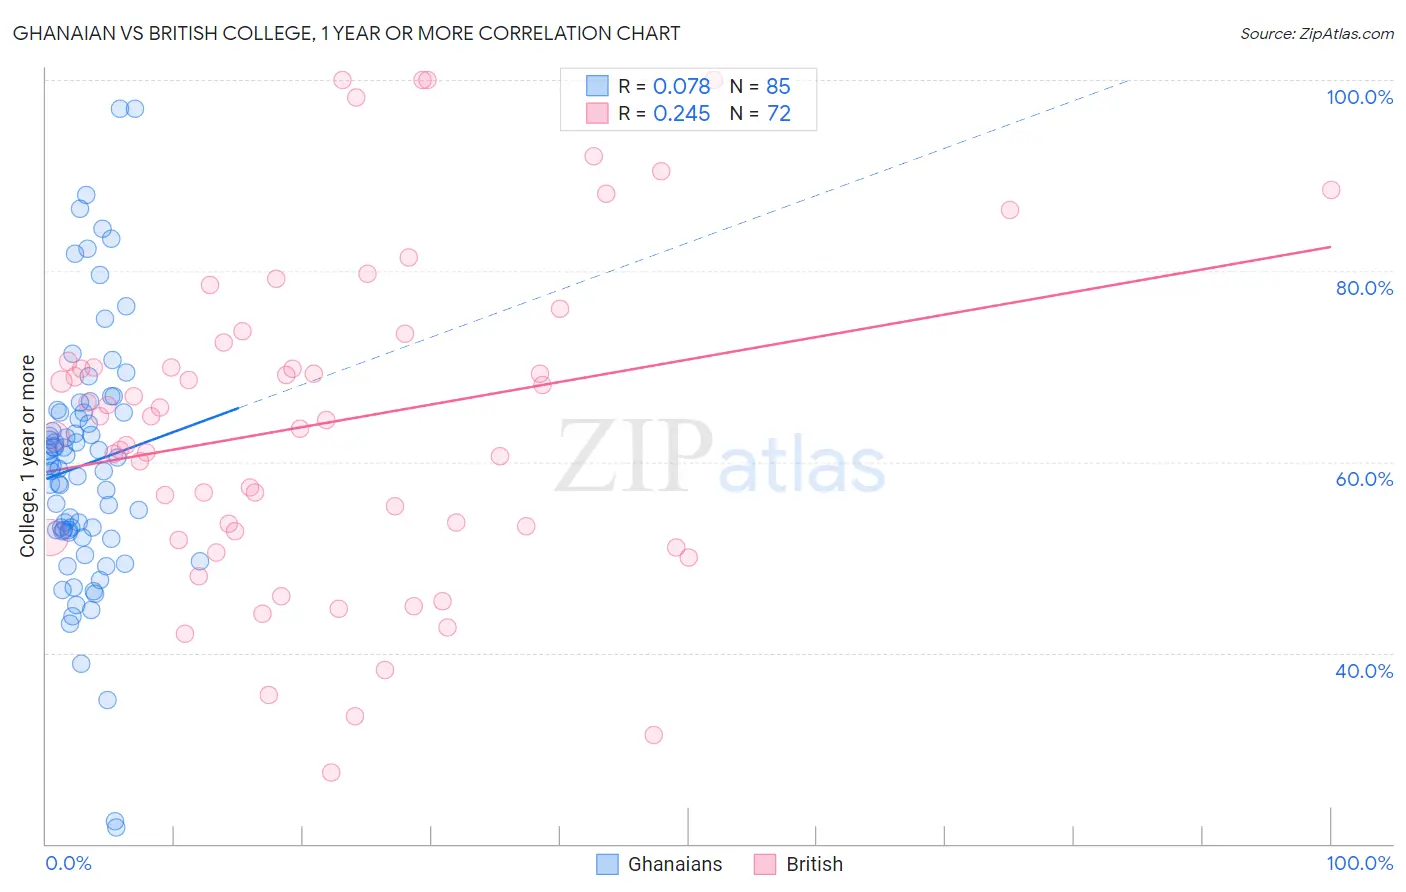
Ghanaian vs British College, 1 year or more Correlation Chart
The statistical analysis conducted on geographies consisting of 190,712,650 people shows a slight positive correlation between the proportion of Ghanaians and percentage of population with at least college, 1 year or more education in the United States with a correlation coefficient (R) of 0.078 and weighted average of 58.4%. Similarly, the statistical analysis conducted on geographies consisting of 531,458,915 people shows a weak positive correlation between the proportion of British and percentage of population with at least college, 1 year or more education in the United States with a correlation coefficient (R) of 0.245 and weighted average of 62.3%, a difference of 6.7%.
College, 1 year or more Correlation Summary
| Measurement | Ghanaian | British |
| Minimum | 21.7% | 27.5% |
| Maximum | 97.0% | 100.0% |
| Range | 75.4% | 72.5% |
| Mean | 59.7% | 64.1% |
| Median | 59.6% | 64.6% |
| Interquartile 25% (IQ1) | 52.7% | 52.5% |
| Interquartile 75% (IQ3) | 65.2% | 71.5% |
| Interquartile Range (IQR) | 12.5% | 19.0% |
| Standard Deviation (Sample) | 13.4% | 17.1% |
| Standard Deviation (Population) | 13.4% | 17.0% |
Similar Demographics by College, 1 year or more
Demographics Similar to Ghanaians by College, 1 year or more
In terms of college, 1 year or more, the demographic groups most similar to Ghanaians are Immigrants from South America (58.4%, a difference of 0.090%), Panamanian (58.3%, a difference of 0.14%), Nigerian (58.5%, a difference of 0.17%), Immigrants from Zaire (58.3%, a difference of 0.19%), and Immigrants from Vietnam (58.2%, a difference of 0.23%).
| Demographics | Rating | Rank | College, 1 year or more |
| Guamanians/Chamorros | 26.2 /100 | #196 | Fair 58.6% |
| Immigrants | Thailand | 26.0 /100 | #197 | Fair 58.6% |
| Immigrants | South Eastern Asia | 25.1 /100 | #198 | Fair 58.5% |
| Slovaks | 24.6 /100 | #199 | Fair 58.5% |
| Spanish | 24.2 /100 | #200 | Fair 58.5% |
| Nigerians | 23.0 /100 | #201 | Fair 58.5% |
| Immigrants | South America | 21.9 /100 | #202 | Fair 58.4% |
| Ghanaians | 20.9 /100 | #203 | Fair 58.4% |
| Panamanians | 19.2 /100 | #204 | Poor 58.3% |
| Immigrants | Zaire | 18.7 /100 | #205 | Poor 58.3% |
| Immigrants | Vietnam | 18.2 /100 | #206 | Poor 58.2% |
| Senegalese | 16.9 /100 | #207 | Poor 58.2% |
| Immigrants | Uruguay | 15.2 /100 | #208 | Poor 58.1% |
| Immigrants | Middle Africa | 14.0 /100 | #209 | Poor 58.0% |
| Tsimshian | 13.5 /100 | #210 | Poor 57.9% |
Demographics Similar to British by College, 1 year or more
In terms of college, 1 year or more, the demographic groups most similar to British are Immigrants from Croatia (62.3%, a difference of 0.10%), Chinese (62.2%, a difference of 0.12%), Jordanian (62.2%, a difference of 0.12%), Carpatho Rusyn (62.2%, a difference of 0.12%), and Croatian (62.2%, a difference of 0.13%).
| Demographics | Rating | Rank | College, 1 year or more |
| Greeks | 98.3 /100 | #88 | Exceptional 62.6% |
| Immigrants | Ethiopia | 98.2 /100 | #89 | Exceptional 62.6% |
| Immigrants | Western Asia | 97.9 /100 | #90 | Exceptional 62.5% |
| Immigrants | Eastern Europe | 97.8 /100 | #91 | Exceptional 62.4% |
| Immigrants | Egypt | 97.8 /100 | #92 | Exceptional 62.4% |
| Romanians | 97.7 /100 | #93 | Exceptional 62.4% |
| Immigrants | Croatia | 97.6 /100 | #94 | Exceptional 62.3% |
| British | 97.4 /100 | #95 | Exceptional 62.3% |
| Chinese | 97.2 /100 | #96 | Exceptional 62.2% |
| Jordanians | 97.2 /100 | #97 | Exceptional 62.2% |
| Carpatho Rusyns | 97.2 /100 | #98 | Exceptional 62.2% |
| Croatians | 97.1 /100 | #99 | Exceptional 62.2% |
| Icelanders | 96.8 /100 | #100 | Exceptional 62.1% |
| Swedes | 96.8 /100 | #101 | Exceptional 62.1% |
| Luxembourgers | 96.7 /100 | #102 | Exceptional 62.1% |