Liberian vs British College, 1 year or more
COMPARE
Liberian
British
College, 1 year or more
College, 1 year or more Comparison
Liberians
British
56.7%
COLLEGE, 1 YEAR OR MORE
3.1/ 100
METRIC RATING
230th/ 347
METRIC RANK
62.3%
COLLEGE, 1 YEAR OR MORE
97.4/ 100
METRIC RATING
95th/ 347
METRIC RANK
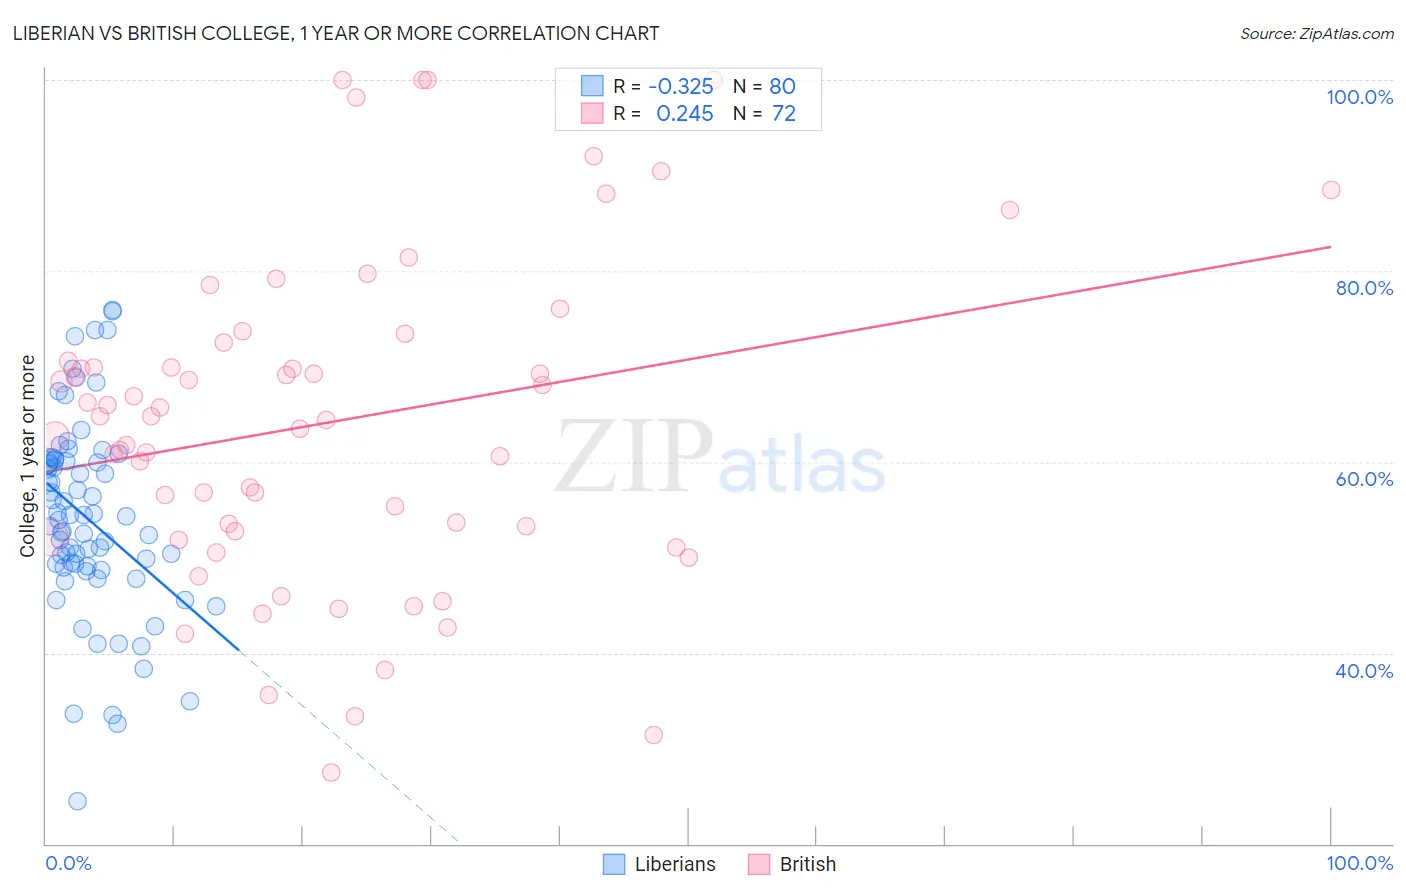
Liberian vs British College, 1 year or more Correlation Chart
The statistical analysis conducted on geographies consisting of 118,103,458 people shows a mild negative correlation between the proportion of Liberians and percentage of population with at least college, 1 year or more education in the United States with a correlation coefficient (R) of -0.325 and weighted average of 56.7%. Similarly, the statistical analysis conducted on geographies consisting of 531,458,915 people shows a weak positive correlation between the proportion of British and percentage of population with at least college, 1 year or more education in the United States with a correlation coefficient (R) of 0.245 and weighted average of 62.3%, a difference of 9.8%.
College, 1 year or more Correlation Summary
| Measurement | Liberian | British |
| Minimum | 24.5% | 27.5% |
| Maximum | 75.9% | 100.0% |
| Range | 51.4% | 72.5% |
| Mean | 54.1% | 64.1% |
| Median | 54.1% | 64.6% |
| Interquartile 25% (IQ1) | 49.0% | 52.5% |
| Interquartile 75% (IQ3) | 60.1% | 71.5% |
| Interquartile Range (IQR) | 11.1% | 19.0% |
| Standard Deviation (Sample) | 10.2% | 17.1% |
| Standard Deviation (Population) | 10.1% | 17.0% |
Similar Demographics by College, 1 year or more
Demographics Similar to Liberians by College, 1 year or more
In terms of college, 1 year or more, the demographic groups most similar to Liberians are Immigrants from Burma/Myanmar (56.6%, a difference of 0.19%), Cree (56.8%, a difference of 0.22%), Immigrants from Bangladesh (56.6%, a difference of 0.25%), Nonimmigrants (56.5%, a difference of 0.34%), and Immigrants from Fiji (56.9%, a difference of 0.35%).
| Demographics | Rating | Rank | College, 1 year or more |
| Portuguese | 5.4 /100 | #223 | Tragic 57.2% |
| Hmong | 5.4 /100 | #224 | Tragic 57.2% |
| Vietnamese | 4.7 /100 | #225 | Tragic 57.0% |
| Immigrants | Western Africa | 4.6 /100 | #226 | Tragic 57.0% |
| Immigrants | Immigrants | 4.4 /100 | #227 | Tragic 57.0% |
| Immigrants | Fiji | 4.0 /100 | #228 | Tragic 56.9% |
| Cree | 3.6 /100 | #229 | Tragic 56.8% |
| Liberians | 3.1 /100 | #230 | Tragic 56.7% |
| Immigrants | Burma/Myanmar | 2.7 /100 | #231 | Tragic 56.6% |
| Immigrants | Bangladesh | 2.6 /100 | #232 | Tragic 56.6% |
| Immigrants | Nonimmigrants | 2.5 /100 | #233 | Tragic 56.5% |
| Spanish Americans | 1.8 /100 | #234 | Tragic 56.3% |
| West Indians | 1.8 /100 | #235 | Tragic 56.3% |
| Iroquois | 1.7 /100 | #236 | Tragic 56.2% |
| Samoans | 1.6 /100 | #237 | Tragic 56.2% |
Demographics Similar to British by College, 1 year or more
In terms of college, 1 year or more, the demographic groups most similar to British are Immigrants from Croatia (62.3%, a difference of 0.10%), Chinese (62.2%, a difference of 0.12%), Jordanian (62.2%, a difference of 0.12%), Carpatho Rusyn (62.2%, a difference of 0.12%), and Croatian (62.2%, a difference of 0.13%).
| Demographics | Rating | Rank | College, 1 year or more |
| Greeks | 98.3 /100 | #88 | Exceptional 62.6% |
| Immigrants | Ethiopia | 98.2 /100 | #89 | Exceptional 62.6% |
| Immigrants | Western Asia | 97.9 /100 | #90 | Exceptional 62.5% |
| Immigrants | Eastern Europe | 97.8 /100 | #91 | Exceptional 62.4% |
| Immigrants | Egypt | 97.8 /100 | #92 | Exceptional 62.4% |
| Romanians | 97.7 /100 | #93 | Exceptional 62.4% |
| Immigrants | Croatia | 97.6 /100 | #94 | Exceptional 62.3% |
| British | 97.4 /100 | #95 | Exceptional 62.3% |
| Chinese | 97.2 /100 | #96 | Exceptional 62.2% |
| Jordanians | 97.2 /100 | #97 | Exceptional 62.2% |
| Carpatho Rusyns | 97.2 /100 | #98 | Exceptional 62.2% |
| Croatians | 97.1 /100 | #99 | Exceptional 62.2% |
| Icelanders | 96.8 /100 | #100 | Exceptional 62.1% |
| Swedes | 96.8 /100 | #101 | Exceptional 62.1% |
| Luxembourgers | 96.7 /100 | #102 | Exceptional 62.1% |