Peruvian vs British College, 1 year or more
COMPARE
Peruvian
British
College, 1 year or more
College, 1 year or more Comparison
Peruvians
British
58.6%
COLLEGE, 1 YEAR OR MORE
27.5/ 100
METRIC RATING
193rd/ 347
METRIC RANK
62.3%
COLLEGE, 1 YEAR OR MORE
97.4/ 100
METRIC RATING
95th/ 347
METRIC RANK
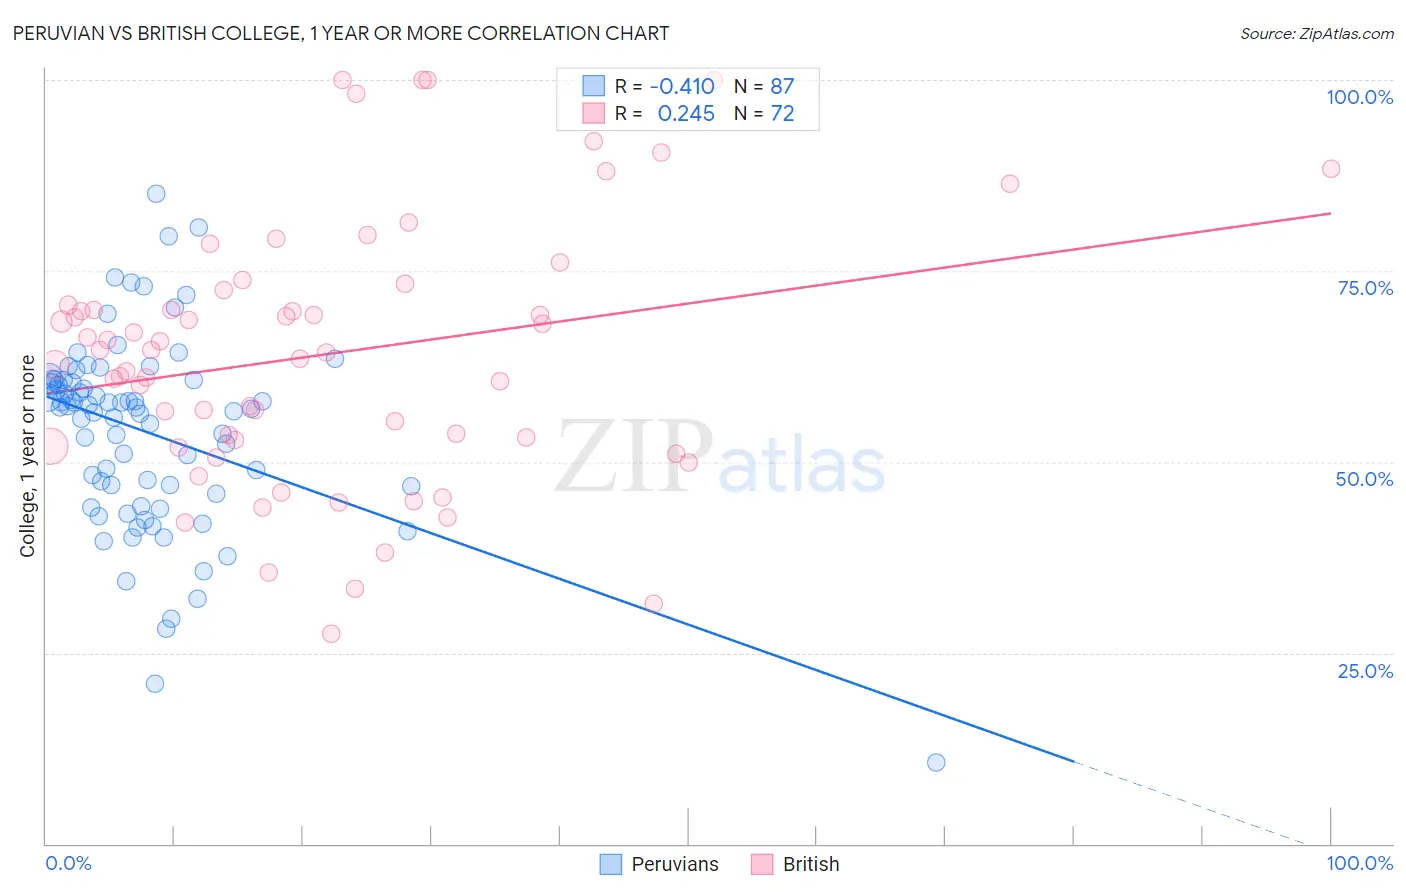
Peruvian vs British College, 1 year or more Correlation Chart
The statistical analysis conducted on geographies consisting of 363,249,143 people shows a moderate negative correlation between the proportion of Peruvians and percentage of population with at least college, 1 year or more education in the United States with a correlation coefficient (R) of -0.410 and weighted average of 58.6%. Similarly, the statistical analysis conducted on geographies consisting of 531,458,915 people shows a weak positive correlation between the proportion of British and percentage of population with at least college, 1 year or more education in the United States with a correlation coefficient (R) of 0.245 and weighted average of 62.3%, a difference of 6.2%.
College, 1 year or more Correlation Summary
| Measurement | Peruvian | British |
| Minimum | 10.6% | 27.5% |
| Maximum | 85.1% | 100.0% |
| Range | 74.5% | 72.5% |
| Mean | 53.9% | 64.1% |
| Median | 57.1% | 64.6% |
| Interquartile 25% (IQ1) | 45.8% | 52.5% |
| Interquartile 75% (IQ3) | 60.7% | 71.5% |
| Interquartile Range (IQR) | 14.9% | 19.0% |
| Standard Deviation (Sample) | 12.7% | 17.1% |
| Standard Deviation (Population) | 12.6% | 17.0% |
Similar Demographics by College, 1 year or more
Demographics Similar to Peruvians by College, 1 year or more
In terms of college, 1 year or more, the demographic groups most similar to Peruvians are Colombian (58.7%, a difference of 0.010%), Costa Rican (58.6%, a difference of 0.070%), Dutch (58.6%, a difference of 0.090%), Guamanian/Chamorro (58.6%, a difference of 0.090%), and Immigrants from Thailand (58.6%, a difference of 0.10%).
| Demographics | Rating | Rank | College, 1 year or more |
| Scotch-Irish | 34.7 /100 | #186 | Fair 58.9% |
| Germans | 34.7 /100 | #187 | Fair 58.9% |
| French | 34.4 /100 | #188 | Fair 58.9% |
| Uruguayans | 31.8 /100 | #189 | Fair 58.8% |
| Immigrants | Cameroon | 31.2 /100 | #190 | Fair 58.8% |
| Immigrants | Philippines | 29.2 /100 | #191 | Fair 58.7% |
| Colombians | 27.6 /100 | #192 | Fair 58.7% |
| Peruvians | 27.5 /100 | #193 | Fair 58.6% |
| Costa Ricans | 26.4 /100 | #194 | Fair 58.6% |
| Dutch | 26.2 /100 | #195 | Fair 58.6% |
| Guamanians/Chamorros | 26.2 /100 | #196 | Fair 58.6% |
| Immigrants | Thailand | 26.0 /100 | #197 | Fair 58.6% |
| Immigrants | South Eastern Asia | 25.1 /100 | #198 | Fair 58.5% |
| Slovaks | 24.6 /100 | #199 | Fair 58.5% |
| Spanish | 24.2 /100 | #200 | Fair 58.5% |
Demographics Similar to British by College, 1 year or more
In terms of college, 1 year or more, the demographic groups most similar to British are Immigrants from Croatia (62.3%, a difference of 0.10%), Chinese (62.2%, a difference of 0.12%), Jordanian (62.2%, a difference of 0.12%), Carpatho Rusyn (62.2%, a difference of 0.12%), and Croatian (62.2%, a difference of 0.13%).
| Demographics | Rating | Rank | College, 1 year or more |
| Greeks | 98.3 /100 | #88 | Exceptional 62.6% |
| Immigrants | Ethiopia | 98.2 /100 | #89 | Exceptional 62.6% |
| Immigrants | Western Asia | 97.9 /100 | #90 | Exceptional 62.5% |
| Immigrants | Eastern Europe | 97.8 /100 | #91 | Exceptional 62.4% |
| Immigrants | Egypt | 97.8 /100 | #92 | Exceptional 62.4% |
| Romanians | 97.7 /100 | #93 | Exceptional 62.4% |
| Immigrants | Croatia | 97.6 /100 | #94 | Exceptional 62.3% |
| British | 97.4 /100 | #95 | Exceptional 62.3% |
| Chinese | 97.2 /100 | #96 | Exceptional 62.2% |
| Jordanians | 97.2 /100 | #97 | Exceptional 62.2% |
| Carpatho Rusyns | 97.2 /100 | #98 | Exceptional 62.2% |
| Croatians | 97.1 /100 | #99 | Exceptional 62.2% |
| Icelanders | 96.8 /100 | #100 | Exceptional 62.1% |
| Swedes | 96.8 /100 | #101 | Exceptional 62.1% |
| Luxembourgers | 96.7 /100 | #102 | Exceptional 62.1% |