Puerto Rican vs British College, 1 year or more
COMPARE
Puerto Rican
British
College, 1 year or more
College, 1 year or more Comparison
Puerto Ricans
British
52.2%
COLLEGE, 1 YEAR OR MORE
0.0/ 100
METRIC RATING
302nd/ 347
METRIC RANK
62.3%
COLLEGE, 1 YEAR OR MORE
97.4/ 100
METRIC RATING
95th/ 347
METRIC RANK
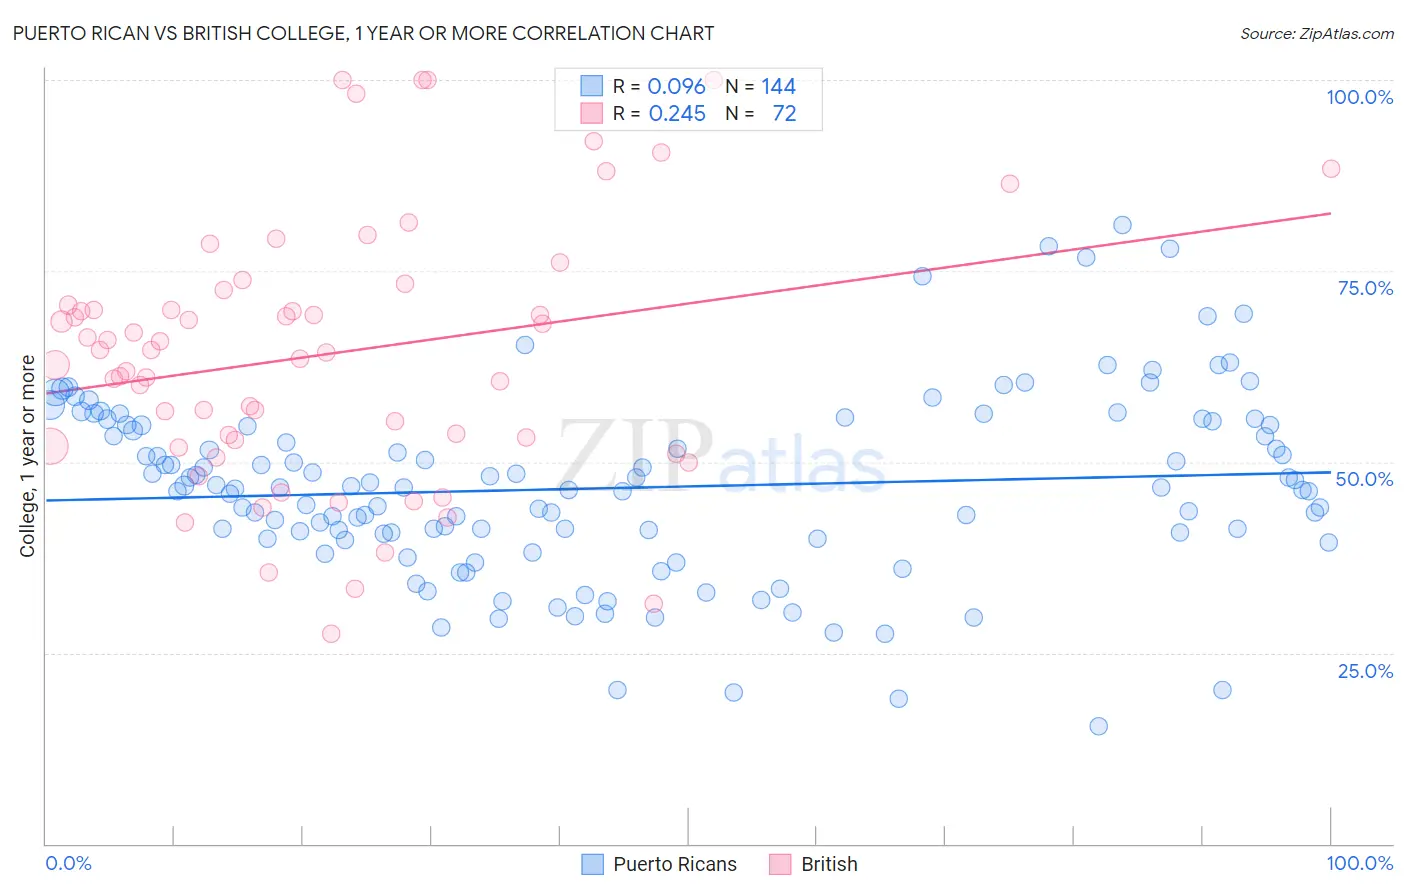
Puerto Rican vs British College, 1 year or more Correlation Chart
The statistical analysis conducted on geographies consisting of 528,315,563 people shows a slight positive correlation between the proportion of Puerto Ricans and percentage of population with at least college, 1 year or more education in the United States with a correlation coefficient (R) of 0.096 and weighted average of 52.2%. Similarly, the statistical analysis conducted on geographies consisting of 531,458,915 people shows a weak positive correlation between the proportion of British and percentage of population with at least college, 1 year or more education in the United States with a correlation coefficient (R) of 0.245 and weighted average of 62.3%, a difference of 19.2%.
College, 1 year or more Correlation Summary
| Measurement | Puerto Rican | British |
| Minimum | 15.4% | 27.5% |
| Maximum | 81.0% | 100.0% |
| Range | 65.6% | 72.5% |
| Mean | 46.6% | 64.1% |
| Median | 46.6% | 64.6% |
| Interquartile 25% (IQ1) | 40.3% | 52.5% |
| Interquartile 75% (IQ3) | 54.8% | 71.5% |
| Interquartile Range (IQR) | 14.5% | 19.0% |
| Standard Deviation (Sample) | 12.0% | 17.1% |
| Standard Deviation (Population) | 12.0% | 17.0% |
Similar Demographics by College, 1 year or more
Demographics Similar to Puerto Ricans by College, 1 year or more
In terms of college, 1 year or more, the demographic groups most similar to Puerto Ricans are Creek (52.2%, a difference of 0.080%), Haitian (52.3%, a difference of 0.13%), Choctaw (52.3%, a difference of 0.19%), Central American (52.1%, a difference of 0.21%), and Immigrants from Nicaragua (52.4%, a difference of 0.23%).
| Demographics | Rating | Rank | College, 1 year or more |
| Yaqui | 0.0 /100 | #295 | Tragic 53.2% |
| Sioux | 0.0 /100 | #296 | Tragic 53.0% |
| Paiute | 0.0 /100 | #297 | Tragic 52.9% |
| Immigrants | Dominica | 0.0 /100 | #298 | Tragic 52.5% |
| Immigrants | Nicaragua | 0.0 /100 | #299 | Tragic 52.4% |
| Choctaw | 0.0 /100 | #300 | Tragic 52.3% |
| Haitians | 0.0 /100 | #301 | Tragic 52.3% |
| Puerto Ricans | 0.0 /100 | #302 | Tragic 52.2% |
| Creek | 0.0 /100 | #303 | Tragic 52.2% |
| Central Americans | 0.0 /100 | #304 | Tragic 52.1% |
| Seminole | 0.0 /100 | #305 | Tragic 52.1% |
| Mexican American Indians | 0.0 /100 | #306 | Tragic 51.9% |
| Immigrants | Portugal | 0.0 /100 | #307 | Tragic 51.9% |
| Salvadorans | 0.0 /100 | #308 | Tragic 51.8% |
| Apache | 0.0 /100 | #309 | Tragic 51.8% |
Demographics Similar to British by College, 1 year or more
In terms of college, 1 year or more, the demographic groups most similar to British are Immigrants from Croatia (62.3%, a difference of 0.10%), Chinese (62.2%, a difference of 0.12%), Jordanian (62.2%, a difference of 0.12%), Carpatho Rusyn (62.2%, a difference of 0.12%), and Croatian (62.2%, a difference of 0.13%).
| Demographics | Rating | Rank | College, 1 year or more |
| Greeks | 98.3 /100 | #88 | Exceptional 62.6% |
| Immigrants | Ethiopia | 98.2 /100 | #89 | Exceptional 62.6% |
| Immigrants | Western Asia | 97.9 /100 | #90 | Exceptional 62.5% |
| Immigrants | Eastern Europe | 97.8 /100 | #91 | Exceptional 62.4% |
| Immigrants | Egypt | 97.8 /100 | #92 | Exceptional 62.4% |
| Romanians | 97.7 /100 | #93 | Exceptional 62.4% |
| Immigrants | Croatia | 97.6 /100 | #94 | Exceptional 62.3% |
| British | 97.4 /100 | #95 | Exceptional 62.3% |
| Chinese | 97.2 /100 | #96 | Exceptional 62.2% |
| Jordanians | 97.2 /100 | #97 | Exceptional 62.2% |
| Carpatho Rusyns | 97.2 /100 | #98 | Exceptional 62.2% |
| Croatians | 97.1 /100 | #99 | Exceptional 62.2% |
| Icelanders | 96.8 /100 | #100 | Exceptional 62.1% |
| Swedes | 96.8 /100 | #101 | Exceptional 62.1% |
| Luxembourgers | 96.7 /100 | #102 | Exceptional 62.1% |