Zimbabwean vs Immigrants from Kuwait Male Disability
COMPARE
Zimbabwean
Immigrants from Kuwait
Male Disability
Male Disability Comparison
Zimbabweans
Immigrants from Kuwait
10.6%
MALE DISABILITY
98.4/ 100
METRIC RATING
79th/ 347
METRIC RANK
10.2%
MALE DISABILITY
99.8/ 100
METRIC RATING
38th/ 347
METRIC RANK
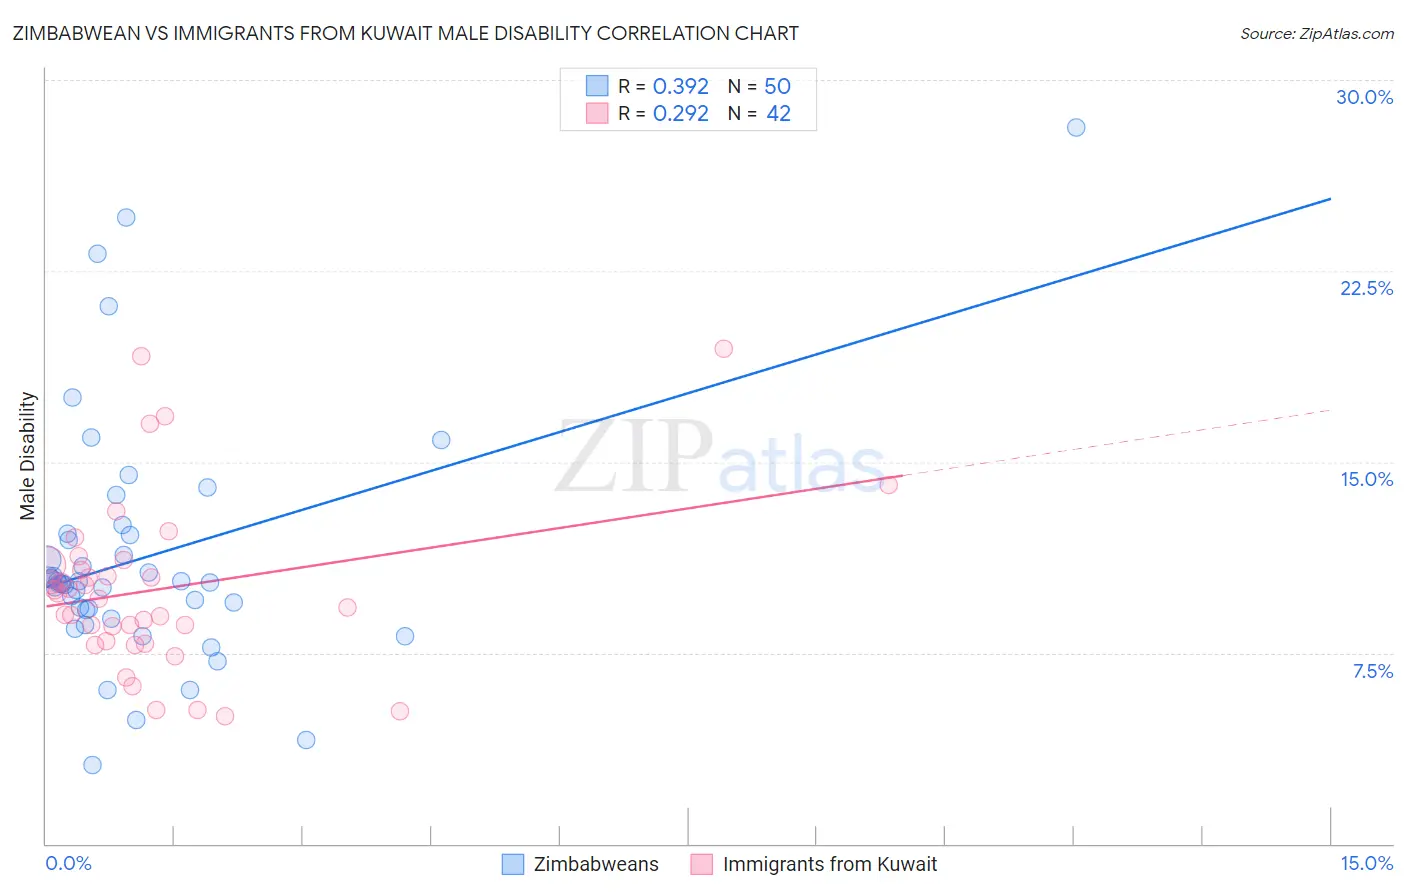
Zimbabwean vs Immigrants from Kuwait Male Disability Correlation Chart
The statistical analysis conducted on geographies consisting of 69,206,379 people shows a mild positive correlation between the proportion of Zimbabweans and percentage of males with a disability in the United States with a correlation coefficient (R) of 0.392 and weighted average of 10.6%. Similarly, the statistical analysis conducted on geographies consisting of 136,916,630 people shows a weak positive correlation between the proportion of Immigrants from Kuwait and percentage of males with a disability in the United States with a correlation coefficient (R) of 0.292 and weighted average of 10.2%, a difference of 3.4%.
Male Disability Correlation Summary
| Measurement | Zimbabwean | Immigrants from Kuwait |
| Minimum | 3.1% | 5.0% |
| Maximum | 28.1% | 19.4% |
| Range | 25.0% | 14.4% |
| Mean | 11.3% | 10.0% |
| Median | 10.2% | 9.7% |
| Interquartile 25% (IQ1) | 9.2% | 7.9% |
| Interquartile 75% (IQ3) | 12.1% | 10.9% |
| Interquartile Range (IQR) | 2.9% | 3.0% |
| Standard Deviation (Sample) | 4.8% | 3.4% |
| Standard Deviation (Population) | 4.8% | 3.3% |
Similar Demographics by Male Disability
Demographics Similar to Zimbabweans by Male Disability
In terms of male disability, the demographic groups most similar to Zimbabweans are Immigrants from Jordan (10.6%, a difference of 0.020%), Immigrants from Chile (10.6%, a difference of 0.080%), Immigrants from Guyana (10.6%, a difference of 0.15%), Immigrants from Poland (10.6%, a difference of 0.21%), and Bulgarian (10.6%, a difference of 0.22%).
| Demographics | Rating | Rank | Male Disability |
| Immigrants | Serbia | 99.0 /100 | #72 | Exceptional 10.5% |
| Immigrants | Lithuania | 98.9 /100 | #73 | Exceptional 10.5% |
| Immigrants | Lebanon | 98.8 /100 | #74 | Exceptional 10.5% |
| Sierra Leoneans | 98.7 /100 | #75 | Exceptional 10.5% |
| Immigrants | Sierra Leone | 98.7 /100 | #76 | Exceptional 10.5% |
| Laotians | 98.6 /100 | #77 | Exceptional 10.6% |
| Immigrants | Russia | 98.6 /100 | #78 | Exceptional 10.6% |
| Zimbabweans | 98.4 /100 | #79 | Exceptional 10.6% |
| Immigrants | Jordan | 98.4 /100 | #80 | Exceptional 10.6% |
| Immigrants | Chile | 98.3 /100 | #81 | Exceptional 10.6% |
| Immigrants | Guyana | 98.2 /100 | #82 | Exceptional 10.6% |
| Immigrants | Poland | 98.1 /100 | #83 | Exceptional 10.6% |
| Bulgarians | 98.1 /100 | #84 | Exceptional 10.6% |
| Sri Lankans | 97.9 /100 | #85 | Exceptional 10.6% |
| Immigrants | Ireland | 97.9 /100 | #86 | Exceptional 10.6% |
Demographics Similar to Immigrants from Kuwait by Male Disability
In terms of male disability, the demographic groups most similar to Immigrants from Kuwait are Afghan (10.2%, a difference of 0.16%), Immigrants from Indonesia (10.2%, a difference of 0.17%), Ethiopian (10.2%, a difference of 0.24%), Immigrants from Argentina (10.2%, a difference of 0.29%), and Immigrants from Nepal (10.3%, a difference of 0.35%).
| Demographics | Rating | Rank | Male Disability |
| Soviet Union | 99.9 /100 | #31 | Exceptional 10.1% |
| Argentineans | 99.9 /100 | #32 | Exceptional 10.1% |
| Immigrants | Ethiopia | 99.9 /100 | #33 | Exceptional 10.2% |
| Immigrants | Turkey | 99.9 /100 | #34 | Exceptional 10.2% |
| Immigrants | Argentina | 99.9 /100 | #35 | Exceptional 10.2% |
| Ethiopians | 99.8 /100 | #36 | Exceptional 10.2% |
| Immigrants | Indonesia | 99.8 /100 | #37 | Exceptional 10.2% |
| Immigrants | Kuwait | 99.8 /100 | #38 | Exceptional 10.2% |
| Afghans | 99.8 /100 | #39 | Exceptional 10.2% |
| Immigrants | Nepal | 99.8 /100 | #40 | Exceptional 10.3% |
| Taiwanese | 99.8 /100 | #41 | Exceptional 10.3% |
| Mongolians | 99.7 /100 | #42 | Exceptional 10.3% |
| Immigrants | Bangladesh | 99.7 /100 | #43 | Exceptional 10.3% |
| Immigrants | El Salvador | 99.7 /100 | #44 | Exceptional 10.3% |
| Turks | 99.7 /100 | #45 | Exceptional 10.3% |