Swiss vs Sri Lankan Median Household Income
COMPARE
Swiss
Sri Lankan
Median Household Income
Median Household Income Comparison
Swiss
Sri Lankans
$85,681
MEDIAN HOUSEHOLD INCOME
59.2/ 100
METRIC RATING
170th/ 347
METRIC RANK
$93,093
MEDIAN HOUSEHOLD INCOME
99.4/ 100
METRIC RATING
79th/ 347
METRIC RANK
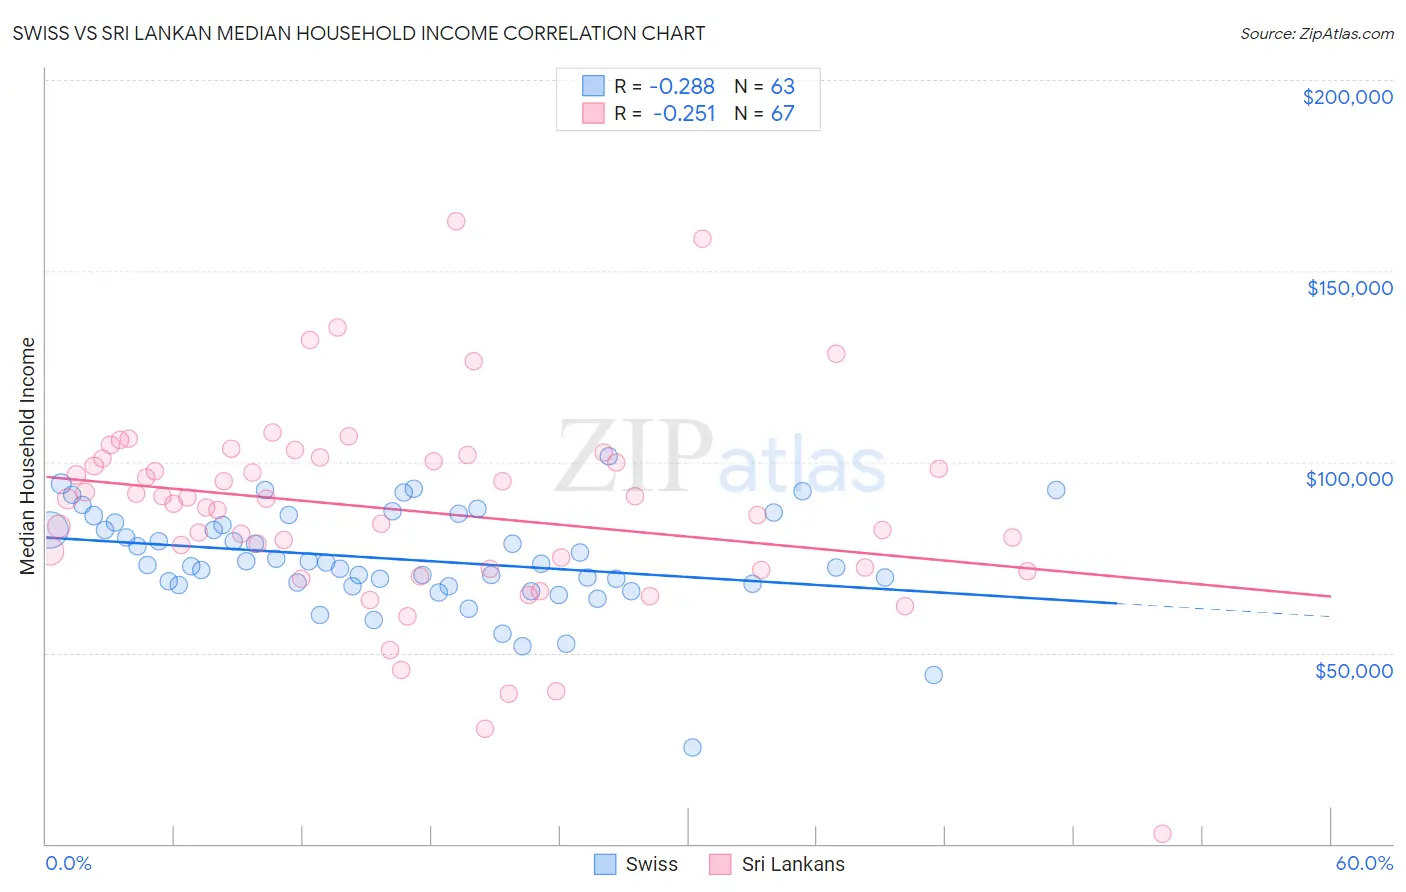
Swiss vs Sri Lankan Median Household Income Correlation Chart
The statistical analysis conducted on geographies consisting of 464,626,684 people shows a weak negative correlation between the proportion of Swiss and median household income in the United States with a correlation coefficient (R) of -0.288 and weighted average of $85,681. Similarly, the statistical analysis conducted on geographies consisting of 439,964,424 people shows a weak negative correlation between the proportion of Sri Lankans and median household income in the United States with a correlation coefficient (R) of -0.251 and weighted average of $93,093, a difference of 8.6%.
Median Household Income Correlation Summary
| Measurement | Swiss | Sri Lankan |
| Minimum | $25,245 | $2,499 |
| Maximum | $101,562 | $163,019 |
| Range | $76,317 | $160,520 |
| Mean | $74,409 | $87,249 |
| Median | $73,303 | $90,272 |
| Interquartile 25% (IQ1) | $67,788 | $71,944 |
| Interquartile 75% (IQ3) | $84,144 | $100,934 |
| Interquartile Range (IQR) | $16,356 | $28,990 |
| Standard Deviation (Sample) | $13,178 | $26,489 |
| Standard Deviation (Population) | $13,073 | $26,291 |
Similar Demographics by Median Household Income
Demographics Similar to Swiss by Median Household Income
In terms of median household income, the demographic groups most similar to Swiss are Colombian ($85,716, a difference of 0.040%), Immigrants from South America ($85,611, a difference of 0.080%), Icelander ($85,797, a difference of 0.14%), Slovene ($85,562, a difference of 0.14%), and Immigrants ($85,818, a difference of 0.16%).
| Demographics | Rating | Rank | Median Household Income |
| Czechs | 66.4 /100 | #163 | Good $86,164 |
| Irish | 66.2 /100 | #164 | Good $86,145 |
| Norwegians | 65.3 /100 | #165 | Good $86,084 |
| Scandinavians | 65.1 /100 | #166 | Good $86,073 |
| Immigrants | Immigrants | 61.3 /100 | #167 | Good $85,818 |
| Icelanders | 61.0 /100 | #168 | Good $85,797 |
| Colombians | 59.7 /100 | #169 | Average $85,716 |
| Swiss | 59.2 /100 | #170 | Average $85,681 |
| Immigrants | South America | 58.1 /100 | #171 | Average $85,611 |
| Slovenes | 57.4 /100 | #172 | Average $85,562 |
| Immigrants | Cameroon | 53.4 /100 | #173 | Average $85,314 |
| Scottish | 50.0 /100 | #174 | Average $85,101 |
| Immigrants | Costa Rica | 49.2 /100 | #175 | Average $85,054 |
| Alsatians | 49.2 /100 | #176 | Average $85,053 |
| Immigrants | Eritrea | 48.8 /100 | #177 | Average $85,025 |
Demographics Similar to Sri Lankans by Median Household Income
In terms of median household income, the demographic groups most similar to Sri Lankans are Tongan ($93,076, a difference of 0.020%), Immigrants from Eastern Europe ($93,051, a difference of 0.050%), Immigrants from Bulgaria ($93,148, a difference of 0.060%), Immigrants from Afghanistan ($93,375, a difference of 0.30%), and South African ($93,379, a difference of 0.31%).
| Demographics | Rating | Rank | Median Household Income |
| Lithuanians | 99.6 /100 | #72 | Exceptional $93,852 |
| Immigrants | Egypt | 99.6 /100 | #73 | Exceptional $93,700 |
| Immigrants | Latvia | 99.6 /100 | #74 | Exceptional $93,602 |
| Immigrants | Italy | 99.5 /100 | #75 | Exceptional $93,465 |
| South Africans | 99.5 /100 | #76 | Exceptional $93,379 |
| Immigrants | Afghanistan | 99.5 /100 | #77 | Exceptional $93,375 |
| Immigrants | Bulgaria | 99.4 /100 | #78 | Exceptional $93,148 |
| Sri Lankans | 99.4 /100 | #79 | Exceptional $93,093 |
| Tongans | 99.4 /100 | #80 | Exceptional $93,076 |
| Immigrants | Eastern Europe | 99.4 /100 | #81 | Exceptional $93,051 |
| Immigrants | Spain | 99.3 /100 | #82 | Exceptional $92,732 |
| Italians | 99.1 /100 | #83 | Exceptional $92,475 |
| Immigrants | Argentina | 99.1 /100 | #84 | Exceptional $92,417 |
| Immigrants | Croatia | 99.0 /100 | #85 | Exceptional $92,225 |
| Immigrants | England | 98.9 /100 | #86 | Exceptional $92,098 |