Lithuanian vs Zimbabwean Disability Age 65 to 74
COMPARE
Lithuanian
Zimbabwean
Disability Age 65 to 74
Disability Age 65 to 74 Comparison
Lithuanians
Zimbabweans
21.4%
DISABILITY AGE 65 TO 74
99.7/ 100
METRIC RATING
48th/ 347
METRIC RANK
21.5%
DISABILITY AGE 65 TO 74
99.5/ 100
METRIC RATING
59th/ 347
METRIC RANK
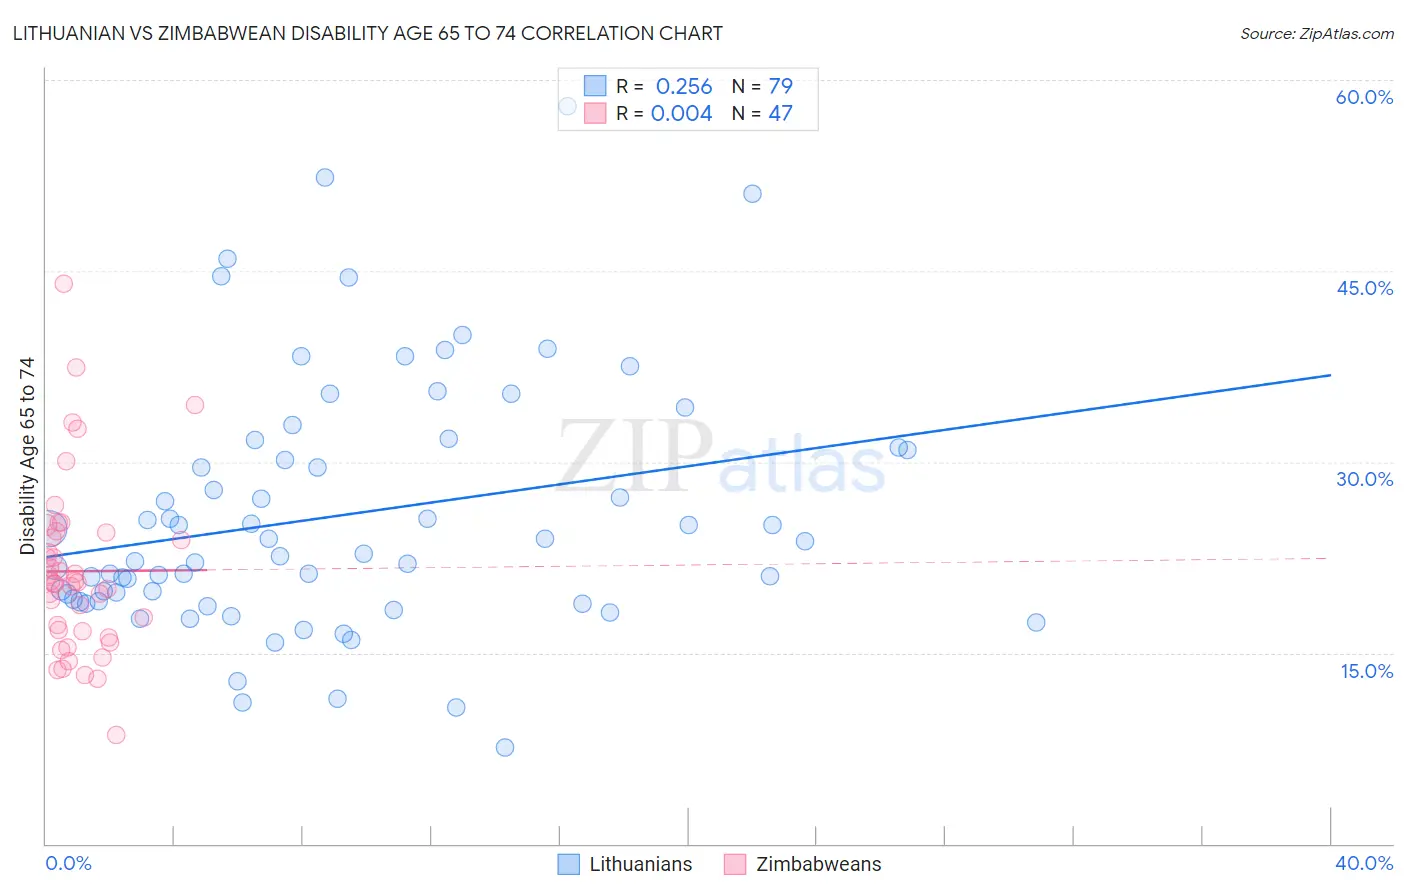
Lithuanian vs Zimbabwean Disability Age 65 to 74 Correlation Chart
The statistical analysis conducted on geographies consisting of 421,207,937 people shows a weak positive correlation between the proportion of Lithuanians and percentage of population with a disability between the ages 65 and 75 in the United States with a correlation coefficient (R) of 0.256 and weighted average of 21.4%. Similarly, the statistical analysis conducted on geographies consisting of 69,127,978 people shows no correlation between the proportion of Zimbabweans and percentage of population with a disability between the ages 65 and 75 in the United States with a correlation coefficient (R) of 0.004 and weighted average of 21.5%, a difference of 0.76%.
Disability Age 65 to 74 Correlation Summary
| Measurement | Lithuanian | Zimbabwean |
| Minimum | 7.6% | 8.6% |
| Maximum | 57.9% | 44.0% |
| Range | 50.3% | 35.4% |
| Mean | 25.8% | 21.4% |
| Median | 22.8% | 20.5% |
| Interquartile 25% (IQ1) | 19.1% | 16.7% |
| Interquartile 75% (IQ3) | 31.1% | 24.4% |
| Interquartile Range (IQR) | 12.0% | 7.7% |
| Standard Deviation (Sample) | 9.9% | 6.8% |
| Standard Deviation (Population) | 9.9% | 6.7% |
Demographics Similar to Lithuanians and Zimbabweans by Disability Age 65 to 74
In terms of disability age 65 to 74, the demographic groups most similar to Lithuanians are Luxembourger (21.4%, a difference of 0.010%), Immigrants from Malaysia (21.4%, a difference of 0.030%), Immigrants from Turkey (21.4%, a difference of 0.050%), Immigrants from Bulgaria (21.4%, a difference of 0.050%), and Asian (21.4%, a difference of 0.080%). Similarly, the demographic groups most similar to Zimbabweans are Immigrants from Pakistan (21.5%, a difference of 0.030%), Immigrants from North Macedonia (21.6%, a difference of 0.030%), Egyptian (21.6%, a difference of 0.050%), Immigrants from Asia (21.5%, a difference of 0.070%), and Carpatho Rusyn (21.6%, a difference of 0.080%).
| Demographics | Rating | Rank | Disability Age 65 to 74 |
| Immigrants | Croatia | 99.7 /100 | #43 | Exceptional 21.3% |
| Estonians | 99.7 /100 | #44 | Exceptional 21.4% |
| Asians | 99.7 /100 | #45 | Exceptional 21.4% |
| Immigrants | Turkey | 99.7 /100 | #46 | Exceptional 21.4% |
| Immigrants | Bulgaria | 99.7 /100 | #47 | Exceptional 21.4% |
| Lithuanians | 99.7 /100 | #48 | Exceptional 21.4% |
| Luxembourgers | 99.7 /100 | #49 | Exceptional 21.4% |
| Immigrants | Malaysia | 99.7 /100 | #50 | Exceptional 21.4% |
| Immigrants | Serbia | 99.6 /100 | #51 | Exceptional 21.4% |
| Immigrants | France | 99.6 /100 | #52 | Exceptional 21.5% |
| Bhutanese | 99.6 /100 | #53 | Exceptional 21.5% |
| Immigrants | Italy | 99.6 /100 | #54 | Exceptional 21.5% |
| Immigrants | Romania | 99.5 /100 | #55 | Exceptional 21.5% |
| Immigrants | Denmark | 99.5 /100 | #56 | Exceptional 21.5% |
| Immigrants | Asia | 99.5 /100 | #57 | Exceptional 21.5% |
| Immigrants | Pakistan | 99.5 /100 | #58 | Exceptional 21.5% |
| Zimbabweans | 99.5 /100 | #59 | Exceptional 21.5% |
| Immigrants | North Macedonia | 99.5 /100 | #60 | Exceptional 21.6% |
| Egyptians | 99.5 /100 | #61 | Exceptional 21.6% |
| Carpatho Rusyns | 99.5 /100 | #62 | Exceptional 21.6% |
| Immigrants | Europe | 99.4 /100 | #63 | Exceptional 21.6% |